. 2010 Apr;176(4):1685-95.
doi: 10.2353/ajpath.2010.091071. Epub 2010 Feb 18.

Adriamycin nephropathy: a failure of endothelial progenitor cell-induced repair

Affiliations

Adriamycin nephropathy: a failure of endothelial progenitor cell-induced repair

Kaoru Yasuda et al. Am J Pathol. 2010 Apr.

Abstract

Adriamycin-associated nephropathy (AAN) remains poorly understood. We hypothesized that adriamycin affects endothelial progenitor cells (EPCs), leading to impaired regeneration. We analyzed renal hematopoietic stem cells (HSCs) and EPCs in mice with AAN and examined the potential contribution of adoptive transfer of intact EPCs to the repair processes. FACS analyses revealed that populations of HSCs and EPCs were scarcely represented in control kidneys and did not change numerically in kidneys obtained from mice with AAN. The observed defect in engraftment was attributable to the decreased viability and increased senescence of EPCs. Adoptive transfer of intact EPCs improved proteinuria and renal function, with a threefold decrease in mortality. Infusion of EPCs to adriamycin-treated mice reduced plasma levels of interleukin-1alpha and -beta and granulocyte-colony stimulating factor as well as increased the level of vascular endothelial growth factor with concomitant improvement of vascular density and reduction of apoptosis. An additional mechanism of tissue repair is proposed based on tunneling nanotube formation between EPCs and endothelial cells exposed to adriamycin, leading to the multiple rounds of exchange between EPCs and mature cells. In conclusion, AAN is associated with development of EPC incompetence; adoptive transfer of intact EPCs blunts morphological and functional manifestations of AAN; and the proposed mechanisms of repair by EPCs include direct incorporation into blood vessels, paracrine signaling, and tunneling nanotube renewal of mitochondrial pool in endothelial cells.


Figures
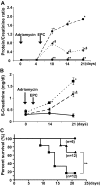
Figure 1
Figure 1
Renal function and survival of mice treated with adriamycin. Circles indicate control; squares, adriamycin; triangles, adriamycin followed by adoptive transfer of EPCs. Arrows indicate the time of infusion of adriamycin and EPCs. A: Urine protein:creatinine ratio. B: Serum creatinine concentration. * and ** denote P < 0.05 versus control and versus adriamycin, respectively (n = 18 each group). C: Kaplan–Meier survival curve. **P < 0.05 versus adriamycin, Logrank test: P < 0.05.
Figure 2
Figure 2
Representative periodic acid-schiff-stained kidney sections and pathological scores. A: Normal control (left); adriamycin-treated (middle); adriamycin followed by adoptive transfer of EPCs (right). Upper panel, scale bar = 100 μm; lower panel, scale bar = 50 μm. See text for detailed description. B: Semiquantitative scores of glomerular and tubulointerstitial injury. All kidneys were harvested on day 21 postadriamycin.
Figure 3
Figure 3
Dynamics of EPCs and HSCs in the kidney during AAN and after adoptive transfer of EPCs. A: The forward scatter (FSC)/side scatter (SSC) dot-plot was used to gate kidney cells (upper left). Gated cells were displayed in the fluorescence FL1/FL2 (FITC on x axis/PE on y axis) dot-plot as unstained control (upper right). Dot plot of anti–CD34-FITC versus anti–Flk-1–PE fluorescence (lower left). Dot plot of anti–c-kit–FITC versus anti–CD150-PE fluorescence (lower right). B: Proportion of EPCs after administration of adriamycin. C: Proportion of HSCs after administration of adriamycin. *P < 0.05 versus control and **P < 0.05 versus adriamycin, respectively; P < 0.05 versus Day 0 and ††P < 0.05 Day 14, respectively (n = 35). Black bars indicate control; gray bars, adriamycin; white bars, adriamycin followed by adoptive transfer of EPCs.
Figure 4
Figure 4
Increased SDF-1 expression in the AAN kidneys and reduced clonogenic potential of EPCs. A: Immunohistochemistry of SDF-1 in kidneys of control (left), adriamycin-treated (middle), and adriamycin-treated mice adoptively transferred with EPCs (right). Magnification of images in the upper and lower panel was ×200 and ×400, respectively. B: Clonogeneicity of EPCs obtained from control and AAN mice. Upper panel: uptake of DiI-labeled acetylated low-density lipoprotein (left), and lectin binding (middle), and merged image (right). Middle panel: plated cells formed clusters (left) and colonies were stained with CD31 (right). Lower panel: number of colony-forming units (n = 5).
Figure 5
Figure 5
Adriamycin reduces viability and induces senescence of EPCs. A: Rate of apoptotic (left) and nonapoptotic (right) death of EPCs harvested from the bone marrow of BALB/c and C57/BL6 mice. X-bar showed each dosage of adriamycin. Cells were harvested and stained 24 hours after adriamycin injection, then analyzed by FACS. *P < 0.05 versus 0 μmol/L, **P < 0.05 versus 1 μmol/L. P < 0.05 versus C57/BL6. White bar indicates C57/BL6; black bar, BALB/c mice. B: Representative images and quantitative summary of stress-induced premature senescence of EPCs. Cells were subjected to adriamycin for 2 hours and stained for senescence-associated β-galactosidase 5 days later. *P < 0.05 vs. 0 μmol/L. White bar: 0 μmol/L, black bar 1 μmol/L.
Figure 6
Figure 6
Representative images and quantitative analysis of labeled EPCs engrafting the AAN kidneys. A: CFDA-labeled EPCs (left); CD31 immunohistochemistry (middle); merged images (right). Upper panel: labeled transferred cells in the glomerulus; middle panel: afferent arteriole; lower panel: vasa recta. Scale bar = 50 μm. B: The approximate number of EPCs engrafting the kidney in AAN was quantified by integrating the number of cells per section (10 μm) to the entire kidney volume. See text for the detailed description. *P < 0.05 versus control+EPC and **P < 0.05 versus day 14. Black bars indicate control+EPC; white bars, adriamycin+EPC.
Figure 7
Figure 7
Analysis of cyto- and chemokine concentrations in the circulation of mice treated with adriamycin in combination with the adoptive transfer of EPCs or without it. AD: Multiplex analysis with Luminex IS100 (only parameters that reached statistical significance are presented.) E: ELISA measurement of VEGF concentration in the plasma. Dotted horizontal lines represent respective controls. *P < 0.05 versus adriamycin.
Figure 8
Figure 8
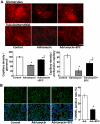
EPC treatment restores microvascular density and reduces the frequency of apoptosis in AAN kidneys. A: Representative images of kidney sections stained for CD31. Upper panel: glomeruli; lower panel: tubulointerstitium. Control, left; adriamycin, middle; and adriamycin followed by adoptive transfer of EPCs, right. Graphs summarize capillary density in each group. Image analysis was performed using National Institutes of Health Image J software. The procedure included threshold image intensity adjustment that enabled identification of microvasculature and quantification of pixels. *P < 0.05 versus control and **P < 0.05 versus adriamycin. Scale bar = 50 μm. B: Representative images of the TUNEL staining of kidney sections. Upper panel: TUNEL-positive cells; lower panel: merged image of nuclear staining with DAPI. Control, left; adriamycin, middle; and adriamycin followed by adoptive transfer of EPCs, right. TUNEL-positive cells were observed mainly in the outer medulla. Bar diagram summarizes the frequency of TUNEL-positive cells. *P < 0.05 versus adriamycin. Scale bar = 50 μm.
Figure 9
Figure 9
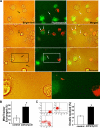
Formation of TNT between intact EPCs and adriamycin-treated HUVECs resulting in mitochondrial exchange. A: A gallery of representative bright-field (left) and merged fluorescence images (middle) and merged fluorescence and bright-field images (right) demonstrating TNT after 24 hours in coculture of CDFA-labeled HUVECs (green fluorescence) and Mitotracker-labeled EPCs (red fluorescence). Black and white arrows show TNT and mitochondrial particles, respectively. Bar = 50 μm. The bottom panel shows magnified images of the boxed region above. B: Exchange rate of Mitotracker (red fluorescence) quantified with fluorescence microscopy. C: Exchanged rate of Mitotracker analyzed by FACS analysis. Dot plot illustrating separate HUVEC staining with CFDA (upper left), EPC staining with Mitotracker (upper right), and after 24 hours in coculture (lower; FL1/FL2: green fluorescence, x axis/red fluorescence, y axis). Right panel: bar diagram summarizing results of FACS analysis of double-stained (denoting that exchange occurred) HUVECs under control conditions and after adriamycin treatment. *P < 0.05 versus control.

Comment in

References

    1. Burke J, Laucius J, Brodovsky H, Soriano R. Doxorubicin hydrochloride-associated renal failure. Arch Intern Med. 1977;137:385–388. - PubMed
    1. Guest I, Uetrecht J. Drugs toxic to the bone marrow that target the stromal cells. Immunopharmacology. 2000;46:103–112. - PubMed
    1. Couture L, Nash J, Turgeon J. The ATP-binding cassette transporters and their implication in drug disposition: a special look at the heart. Pharmacol. 2006;Rev 58:244–258. - PubMed
    1. Turnberg D, Lewis M, Moss J, Xu Y, Botto M, Cook T. Complement activation contributes to both glomerular and tubulointerstitial damage in adriamycin nephropathy in mice. J Immunol. 2006;177:4094–4102. - PubMed
    1. Kramer A, Hoven van den M, Rops A, Wijnhoven T, Heuvel van den L, Lensen J, van Kuppevelt T, van Goor H, van den Vlag J, Navis G, Berden J. Induction of glomerular heparanase expression in rats with adriamycin nephropathy is regulated by reactive oxygen species and the rennin-angiotensin system. J Am Soc Nephrol. 2006;17:2513–2520. - PubMed

Publication types