

Establishment and genomic characterization of mouse xenografts of human primary prostate tumors
- PMID: 20167861
- PMCID: PMC2843479
- DOI: 10.2353/ajpath.2010.090873
Establishment and genomic characterization of mouse xenografts of human primary prostate tumors
Abstract
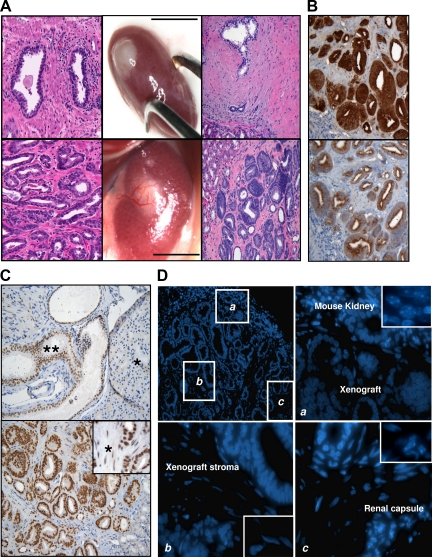
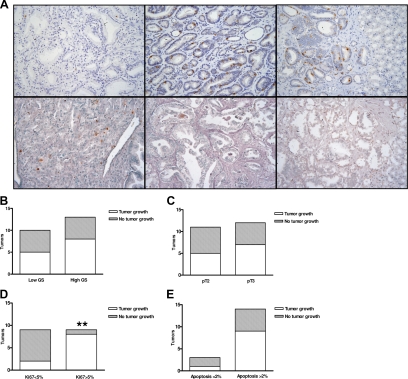
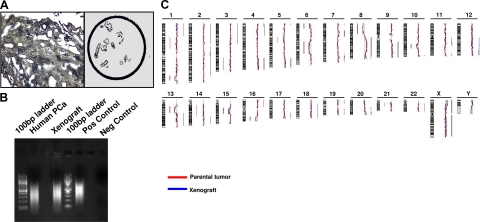
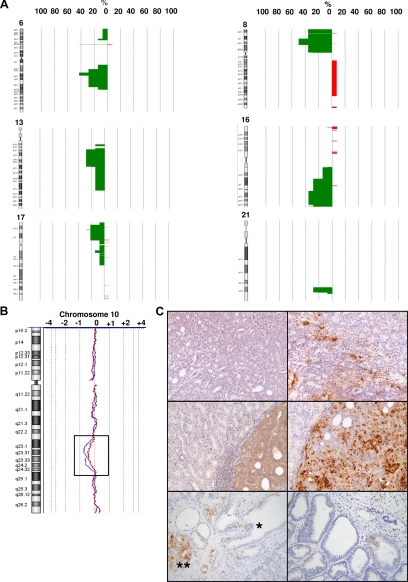
Serum prostate-specific antigen screening has led to earlier detection and surgical treatment of prostate cancer, favoring an increasing incidence-to-mortality ratio. However, about one third of tumors that are diagnosed when still confined to the prostate can relapse within 10 years from the first treatment. The challenge is therefore to identify prognostic markers of aggressive versus indolent tumors. Although several preclinical models of advanced prostate tumors are available, a model that recapitulates the genetic and growth behavior of primary tumors is still lacking. Here, we report a complete histopathological and genomic characterization of xenografts derived from primary localized low- and high-grade human prostate tumors that were implanted under the renal capsule of immunodeficient mice. We obtained a tumor take of 56% and show that these xenografts maintained the histological as well as most genomic features of the parental tumors. Serum prostate-specific antigen levels were measurable only in tumor xenograft-bearing mice, but not in those implanted with either normal prostate tissue or in tumors that likely regressed. Finally, we show that a high proliferation rate, but not the pathological stage or the Gleason grade of the original tumor, was a fundamental prerequisite for tumor take in mice. This mouse xenograft model represents a useful preclinical model of primary prostate tumors for their biological characterization, biomarker discovery, and drug testing.
Figures

Similar articles
-
Severe combined immunodeficient-hu model of human prostate cancer metastasis to human bone.Cancer Res. 1999 Apr 15;59(8):1987-93. Cancer Res. 1999. PMID: 10213511
-
Alpha-tocopheryl succinate (alpha-TOS) modulates human prostate LNCaP xenograft growth and gene expression in BALB/c nude mice fed two levels of dietary soybean oil.Eur J Nutr. 2007 Feb;46(1):34-43. doi: 10.1007/s00394-006-0629-4. Epub 2006 Dec 15. Eur J Nutr. 2007. PMID: 17180484
-
Establishing prostate cancer patient derived xenografts: lessons learned from older studies.Prostate. 2015 May;75(6):628-36. doi: 10.1002/pros.22946. Epub 2015 Jan 5. Prostate. 2015. PMID: 25560784 Free PMC article.
-
Hierarchical organization of prostate cancer cells in xenograft tumors: the CD44+alpha2beta1+ cell population is enriched in tumor-initiating cells.Cancer Res. 2007 Jul 15;67(14):6796-805. doi: 10.1158/0008-5472.CAN-07-0490. Cancer Res. 2007. PMID: 17638891
-
Human prostate cancer heterotransplants: a review on this experimental model.Asian J Androl. 2010 Jul;12(4):509-18. doi: 10.1038/aja.2010.17. Epub 2010 Apr 5. Asian J Androl. 2010. PMID: 20364154 Free PMC article. Review.
Cited by
-
Generation, evolution, interfering factors, applications, and challenges of patient-derived xenograft models in immunodeficient mice.Cancer Cell Int. 2023 Jun 21;23(1):120. doi: 10.1186/s12935-023-02953-3. Cancer Cell Int. 2023. PMID: 37344821 Free PMC article. Review.
-
Preclinical models for development of immune-oncology therapies.Immuno-oncol Insights. 2022;3(8):379-398. doi: 10.18609/ioi.2022.41. Epub 2022 Sep 26. Immuno-oncol Insights. 2022. PMID: 37132013 Free PMC article.
-
Generation of Prostate Cancer Patient-Derived Xenografts to Investigate Mechanisms of Novel Treatments and Treatment Resistance.Methods Mol Biol. 2018;1786:1-27. doi: 10.1007/978-1-4939-7845-8_1. Methods Mol Biol. 2018. PMID: 29786784 Free PMC article.
-
To target or not to target the enemy within localized prostate cancer.Cell Cycle. 2013 Nov 1;12(21):3349-50. doi: 10.4161/cc.26576. Epub 2013 Sep 23. Cell Cycle. 2013. PMID: 24091534 Free PMC article. No abstract available.
-
Preclinical humanized mouse model with ectopic ovarian tissues.Exp Ther Med. 2014 Sep;8(3):742-746. doi: 10.3892/etm.2014.1819. Epub 2014 Jul 1. Exp Ther Med. 2014. PMID: 25120592 Free PMC article.
References
-
- D'Amico AV, Whittington R, Malkowicz SB, Weinstein M, Tomaszewski JE, Schultz D, Rhude M, Rocha S, Wein A, Richie JP. Predicting prostate specific antigen outcome preoperatively in the prostate specific antigen era. J Urol. 2001;166:2185–2188. - PubMed
-
- Thompson I, Thrasher JB, Aus G, Burnett AL, Canby-Hagino ED, Cookson MS, D'Amico AV, Dmochowski RR, Eton DT, Forman JD, Goldenberg SL, Hernandez J, Higano CS, Kraus SR, Moul JW, Tangen CM. Guideline for the management of clinically localized prostate cancer: 2007 update. J Urol. 2007;177:2106–2131. - PubMed
-
- Sobel RE, Sadar MD. Cell lines used in prostate cancer research: a compendium of old and new lines–part 2. J Urol. 2005;173:360–372. - PubMed
-
- Sobel RE, Sadar MD. Cell lines used in prostate cancer research: a compendium of old and new lines–part 1. J Urol. 2005;173:342–359. - PubMed
Publication types
MeSH terms
Substances
Grants and funding
LinkOut - more resources
Full Text Sources
Medical
