. 2010 Apr;176(4):1959-72.
doi: 10.2353/ajpath.2010.090653. Epub 2010 Feb 18.

Transcription factor Stat3 stimulates metastatic behavior of human prostate cancer cells in vivo, whereas Stat5b has a preferential role in the promotion of prostate cancer cell viability and tumor growth

Affiliations

Transcription factor Stat3 stimulates metastatic behavior of human prostate cancer cells in vivo, whereas Stat5b has a preferential role in the promotion of prostate cancer cell viability and tumor growth

Lei Gu et al. Am J Pathol. 2010 Apr.

Abstract

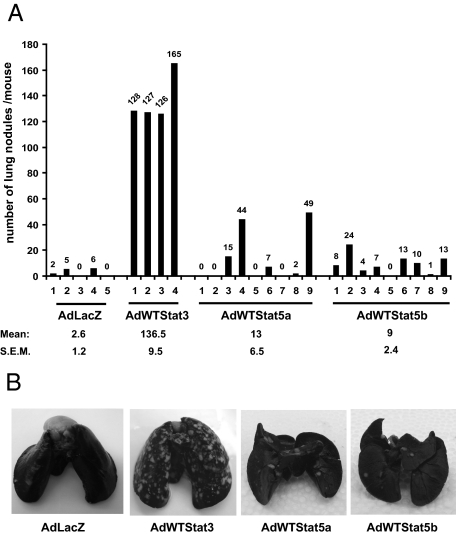
Identification of the molecular changes that promote viability and metastatic behavior of prostate cancer is critical for the development of improved therapeutic interventions. Stat5a/b and Stat3 are both constitutively active in locally-confined and advanced prostate cancer, and both transcription factors have been reported to be critical for the viability of prostate cancer cells. We recently showed that Stat3 promotes metastatic behavior of human prostate cancer cells not only in vitro but also in an in vivo experimental metastases model. In this work, we compare side-by-side Stat5a/b versus Stat3 in the promotion of prostate cancer cell viability, tumor growth, and induction of metastatic colonization in vivo. Inhibition of Stat5a/b induced massive death of prostate cancer cells in culture and reduced both subcutaneous and orthotopic prostate tumor growth, whereas Stat3 had a predominant role over Stat5a/b in promoting metastases formation of prostate cancer cells in vivo in nude mice. The molecular mechanisms underlying the differential biological effects induced by these two transcription factors involve largely different sets of genes regulated by Stat5a/b versus Stat3 in human prostate cancer model systems. Of the two Stat5 homologs, Stat5b was more important for supporting growth of prostate cancer cells than Stat5a. This work provides the first mechanistic comparison of the biological effects induced by transcription factors Stat5a/b versus Stat3 in prostate cancer.


Figures

Figure 1
Figure 1
Inhibition of Stat5a/b caused a robust decrease in the number of viable DU145 human prostate cancer cells, whereas the effects of Stat3 inhibition were less pronounced. A: Transcription factors Stat5 and Stat3 are both constitutively active in DU145 prostate cancer cells. Stat5a or Stat5b were immunoprecipitated (IP) from exponentially growing CWR22Rv1, LNCaP, and DU145 cells using anti-Stat5a or anti-Stat5b pAbs, and blotted (WB) with anti–phospho-Stat5a/b (anti-pYStat5a/b) antibody, as indicated. Whole cell lysates (WCL) were blotted with anti-phospho-Stat3 (anti-pYStat3) antibody. Filters were stripped and re-blotted with anti-Stat5ab or anti-Stat3 mAbs, and whole cell lysates before IP were immunoblotted with anti-actin pAb. B: To verify the specificity of the siRNAs, DU145 cells were transfected with siRNA targeted to Stat5a, Stat5b, or Stat3, with scrambled siRNAs or nontransfected cells as controls. The cells were harvested 48 hours after the siRNA transfection. Stat5a and Stat5b were immunoprecipitated with anti-Stat5a and anti-Stat5b pAbs, respectively, and blotted with anti-Stat5a/b mAb, as indicated. Whole cell lysates (WCL) of the same samples were blotted with anti–phospho-Stat3 (anti-pYStat3), anti-Stat3, or anti-actin pAbs. C: Inhibition of Stat5b by RNA interference decreased the number of viable DU145 cells, whereas the effects of Stat5a or Stat3 inhibition were less evident. The number of live cells after inhibition of Stat5a, Stat5b, Stat5a/b, or Stat3 by specific siRNAs, control group was incubated with transfection reagent only. After trypan blue exclusion, the attached viable DU145 cells were counted 72 hours after the siRNA transfection. The bars indicate mean ± SD of triplicate wells. D: Microscope photographs of the DU145 cells 72 hours after the transfection show the cell morphology. siRNAs targeted to Stat5b or Stat5a/b induced massive detachment and rounding of DU145 cells, whereas Stat5a or Stat3 siRNA caused hardly detectable effects on the cell numbers or the cell morphology. E: Inhibition of Stat5a/b by adenoviral (Ad) gene delivery of a dominant-negative (DN) Stat5a/b decreased significantly the number of viable prostate cancer cells, whereas Stat3 inhibition effects were only minor. DU145 cells were infected with AdWTStat5b, AdDNStat5a/b, AdWTStat3, AdDNStat3, or with AdLacZ at MOI 5 using mock-infected cells as an additional control. After trypan blue staining, the cells were photographed and counted after 72 hours. The bars indicate mean ± SD of triplicate wells. F: Microscope photographs demonstrate the cell morphology after 72 hours infection of the cells with AdDNStat5a/b, AdWTStat5b, AdDNStat3, AdWTStat3 versus AdLacZ or mock-infected cells. Inhibition of Stat5a/b induced detachment, rounding, and shrinkage of the cells, which are all characteristics of apoptosis.
Figure 2
Figure 2
Inhibition of Stat5a/b, not Stat3, has a major effect in blocking DU145 prostate cancer subcutaneous and orthotopic xenograft tumor growth in athymic nude mice. A: Subcutaneous tumor growth of DU145 prostate cancer cells infected with adenovirus (Ad) expressing DNStat5a/b, WTStat5b, DNStat3 or WTStat3. Twenty-four hours after the infection with AdDNStat5a/b, AdWTStat5b, AdDNStat3, or AdWTStat3 at MOI 5, the cells were inoculated subcutaneously into flanks of castrated athymic nude mice supplied with sustained-release 5α-dihydrotestosterone (DHT)-pellets (n = 7 per group, 1 tumor per mouse, 20 × 106 DU145 cells per site, 1 DHT pellet/mouse). The tumor growth was measured once a week for 69 days. Tumor volumes were calculated using the formula V = (π/6) × d1× (d2)2, with d1 and d2 being two perpendicular tumor diameters. B: Orthotopic growth of DU145 prostate cancer cells infected with adenovirus (Ad) expressing DNStat3, WTStat3, DNStat5a/b, WTStat5b, or LacZ. DU145 cells were inoculated orthotopically in the dorsolateral prostates of athymic nude mice (1 × 10⁶ DU145 cells per injection) supplied with DHT-pellets (1 pellet per mouse). Prior (24 hours) to the injection, the DU145 cells had been infected with AdDNStat5a/b, AdWTStat5b, AdDNStat3, AdWTStat3, or AdLacZ at MOI 5. Mice were sacrificed 8 weeks after tumor cell inoculation, and the tumor volumes were calculated using the formula V = (π/6) × d1× (d2)2, with d1 and d2 being two perpendicular tumor diameters. C: Inhibition of Stat5a/b does not affect the viability of normal human prostate epithelial cell lines, but caused a decrease in the number of viable LNCaP and CWR22Rv1 cells. Normal prostate epithelial cell lines, RC165N and RC170N, and human prostate cancer cell lines, LNCaP, CWR22Rv1, and PC-3, were infected with AdWTStat5b, AdDNStat5a/b, AdWTStat3, AdDNStat3, or AdLacZ at MOI 5. The cell viability was determined 72 hours after the adenoviral gene delivery by MTS (3-[4,5-dimethylthiazolyl-2]−2,5-diphenyl-tetrazolium bromide) metabolic activity assay. D: Melanoma (A5028), hepatocellular (HepG2), colorectal (HCT116), lung (A549), pancreatic (Hs766T and CAPAN), and breast (MCF-7 and T47D) cancer cell lines were infected with AdWTStat5b, AdDNStat5a/b, AdWTStat3, AdDNStat3, or AdLacZ at MOI 5, and the cell viability was determined 72 hours after the adenoviral gene delivery by MTS assay. The bars indicate mean ± SD of triplicate determinations. E: Stat5a and Stat5b were immunoprecipitated using anti-Stat5a and anti-Stat5b pAbs, respectively, and immunoprecipitates and whole cell lysates (WCL) were blotted with anti-Stat5a/b mAb or anti-Stat3 pAb, as indicated. Anti-actin immunoblotting of whole cell lysates indicates equal level of proteins in the immunoprecipitations.
Figure 3
Figure 3
Stat3 has a preferential role in promoting prostate cancer metastases formation in an experimental metastases assay. A: Athymic nude mice were injected with DU145 cells infected with adenovirus expressing LacZ, WTStat3, WTStat5a, or WTStat5b at MOI 5 (1 × 10⁶ cells per mouse) through the tail-vein. After 8 weeks, the lungs were harvested and stained with India Ink, bleached with Fekete’s solution, and scored for surface lung metastases. B: Representative photographs of India Ink–stained lungs derived from athymic nude mice injected with LacZ, WTStat3, WTStat5a, or WTStat5b expressing DU145 cells after 8 weeks.
Figure 4
Figure 4
Identification of Stat5 and/or Stat3-regulated genes in DU145 human prostate cancer cells. A: Inhibition of Stat5a/b or Stat3 protein expression human prostate cancer cells. DU145 and CWR22Rv1 cells were transfected with siRNA targeted to Stat5a/b or Stat3, with scrambled siRNA as control. Cells were harvested 48 hours after the transfection, lysed, and immunoblotted with anti-Stat5a/b mAb or anti-Stat3 pAb, as indicated. The lower parts of the filters were blotted with anti-actin antibody to demonstrate equal loading (bottom panel). B: Venn-diagrams of Stat5a/b- and/or Stat3-regulated genes in DU145 human prostate cancer cells. C: The relative proportions of Stat5a/b versus Stat3 vs. Stat5-Stat3–regulated genes in DU145 prostate cancer cells related to metastases, proliferation, or apoptosis out of total of 1409 genes differentially expressed between control siRNA and Stat5a/b or Stat3 siRNA using false-discovery rate <0.01 on the full dataset of 15,992 genes. The functional groups were identified using the Gene Ontology annotations. D: A heatmap showing the top differentially expressed genes by Stat5a/b (determined by the smallest P values) related to metastases, apoptosis, or proliferation. Red represents higher expression, whereas green represent lower expression in the heatmap. For comparison, the levels of the gene expression for the corresponding genes in the groups where Stat3 was inhibited are shown in the middle of the heatmap. E: A heatmap showing the top differentially expressed genes by Stat3 (determined by the smallest P values) related to metastases, apoptosis, or proliferation. Red represents higher expression, whereas green represent lower expression in the heatmap. For comparison, the levels of the gene expression for the corresponding genes in the groups where Stat5a/b was inhibited are shown in the left side of the heatmap. F: A heatmap showing the top differentially expressed genes by Stat5a/b and Stat3 (determined by the smallest P values) related to metastases, apoptosis, or proliferation. Red represents higher expression, whereas green represent lower expression in the heatmap.
Figure 5
Figure 5
Identification of Stat5 and/or Stat3-regulated genes in CWR22Rv1 human prostate cancer cells. A: Venn diagrams of Stat5a/b- and/or Stat3-regulated genes in CWR22Rv1 human prostate cancer cells. B: Transcriptional profiles of Stat5a/b versus Stat3-regulated genes in CWR22Rv1 prostate cancer cells related to metastases, proliferation, or apoptosis out of total of 1344 genes differentially expressed between control siRNA and Stat5a/b or Stat3 siRNA using false-discovery rate <0.01 on the full dataset of 15,992 genes. The functional groups were identified using the Gene Ontology annotations. C: A heatmap showing the top differentially expressed genes by Stat5a/b (determined by the smallest P values) in CWR22Rv1 cells related to metastases, apoptosis, or proliferation. Red represents higher expression, whereas green represent lower expression in the heatmap. For comparison, the levels of the gene expression for the corresponding genes in the groups where Stat3 was inhibited are shown in the middle of the heatmap. D: A heatmap showing the top differentially expressed genes by Stat3 (determined by the smallest P values) in CWR22Rv1 cells related to metastases, apoptosis, or proliferation. Red represents higher expression, whereas green represent lower expression in the heatmap. For comparison, the levels of the gene expression for the corresponding genes in the groups where Stat5a/b was inhibited are shown on the left side of the heatmap. E: A heatmap showing the top differentially expressed genes by Stat5a/b and Stat3 (determined by the smallest P values) in CWR22Rv1 cells related to metastases, apoptosis, or proliferation. Red represents higher expression, whereas green represent lower expression in the heatmap.

Similar articles

Cited by

References

    1. Damber JE, Aus G. Prostate cancer. Lancet. 2008;371:1710–1721. - PubMed
    1. Ahonen TJ, Xie J, LeBaron MJ, Zhu J, Nurmi M, Alanen K, Rui H, Nevalainen MT. Inhibition of transcription factor Stat5 induces cell death of human prostate cancer cells. J Biol Chem. 2003;278:27287–27292. - PubMed
    1. Li H, Zhang Y, Glass A, Zellweger T, Gehan E, Bubendorf L, Gelmann EP, Nevalainen MT. Activation of signal transducer and activator of transcription-5 in prostate cancer predicts early recurrence. Clin Cancer Res. 2005;11:5863–5868. - PubMed
    1. Li H, Ahonen TJ, Alanen K, Xie J, LeBaron MJ, Pretlow TG, Ealley EL, Zhang Y, Nurmi M, Singh B, Martikainen PM, Nevalainen MT. Activation of signal transducer and activator of transcription 5 in human prostate cancer is associated with high histological grade. Cancer Res. 2004;64:4774–4782. - PubMed
    1. Mora LB, Buettner R, Seigne J, Diaz J, Ahmad N, Garcia R, Bowman T, Falcone R, Fairclough R, Cantor A, Muro-Cacho C, Livingston S, Karras J, Pow-Sang J, Jove R. Constitutive activation of Stat3 in human prostate tumors and cell lines: direct inhibition of Stat3 signaling induces apoptosis of prostate cancer cells. Cancer Res. 2002;62:6659–6666. - PubMed

Publication types