

Conditions for the evolution of gene clusters in bacterial genomes
- PMID: 20168992
- PMCID: PMC2820515
- DOI: 10.1371/journal.pcbi.1000672
Conditions for the evolution of gene clusters in bacterial genomes
Abstract
Genes encoding proteins in a common pathway are often found near each other along bacterial chromosomes. Several explanations have been proposed to account for the evolution of these structures. For instance, natural selection may directly favour gene clusters through a variety of mechanisms, such as increased efficiency of coregulation. An alternative and controversial hypothesis is the selfish operon model, which asserts that clustered arrangements of genes are more easily transferred to other species, thus improving the prospects for survival of the cluster. According to another hypothesis (the persistence model), genes that are in close proximity are less likely to be disrupted by deletions. Here we develop computational models to study the conditions under which gene clusters can evolve and persist. First, we examine the selfish operon model by re-implementing the simulation and running it under a wide range of conditions. Second, we introduce and study a Moran process in which there is natural selection for gene clustering and rearrangement occurs by genome inversion events. Finally, we develop and study a model that includes selection and inversion, which tracks the occurrence and fixation of rearrangements. Surprisingly, gene clusters fail to evolve under a wide range of conditions. Factors that promote the evolution of gene clusters include a low number of genes in the pathway, a high population size, and in the case of the selfish operon model, a high horizontal transfer rate. The computational analysis here has shown that the evolution of gene clusters can occur under both direct and indirect selection as long as certain conditions hold. Under these conditions the selfish operon model is still viable as an explanation for the evolution of gene clusters.
Conflict of interest statement
The authors have declared that no competing interests exist.
Figures
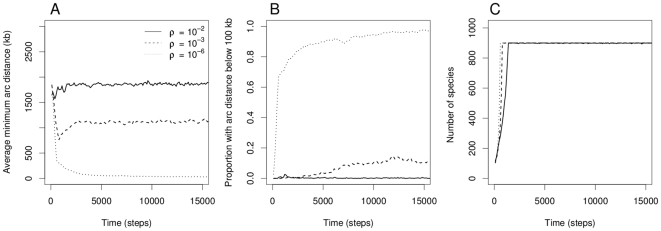
 , indicated in solid (
 ), dashed (
 ) and dotted curves (
 ). Unless indicated otherwise, there are three genes in the pathway and the parameter values are
  ,
,  and
and  . Only the first 15,000 steps of the simulations are shown here.
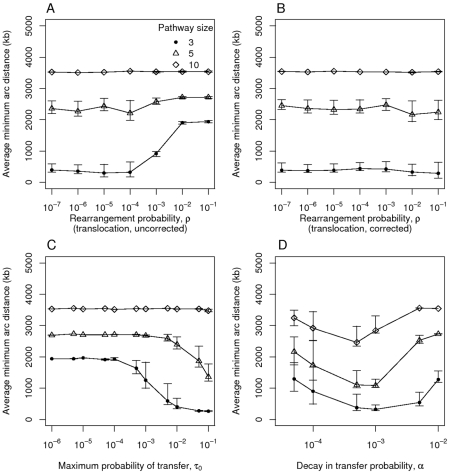
 under the original uncorrected translocation process, B) rearrangement probability
  with the translocation process corrected so that the probability
  of choosing the genes in question is included, C) the maximum transfer probability
  ; D) the parameter
  , which describes the decay in the horizontal transfer rate over distance. Each point indicates the mean of 100 runs and error bars show the central 90% of simulations. Each simulation was run for 50,000 time steps. Unless indicated otherwise, there are three genes in the pathway and the parameter values are
  ,
,  , and
, and  .
.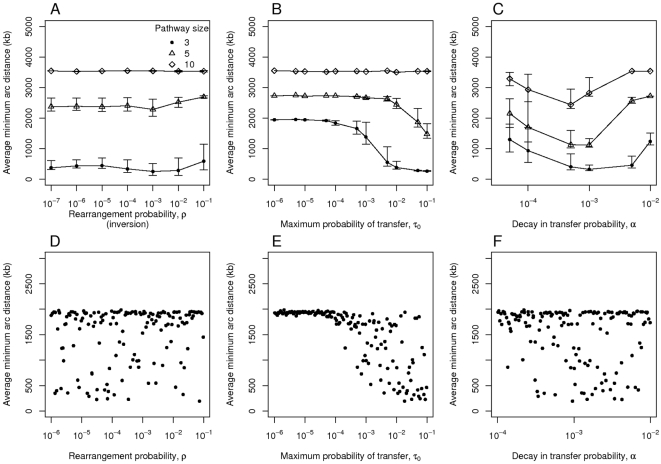
 . The plots show distances over the probability
  of rearrangement, which occurs here through inversion (panels A and D), the maximum probability of transfer
  (B and E) and the decay in transfer probability over distance
  (C and F). The default parameter values for these simulations are
  ,
,  and
and  The bottom three panels (D–F) show the results of simulations for
  in which the parameters were set randomly according to latin hypercube sampling with 150 points and 40 simulations per point.
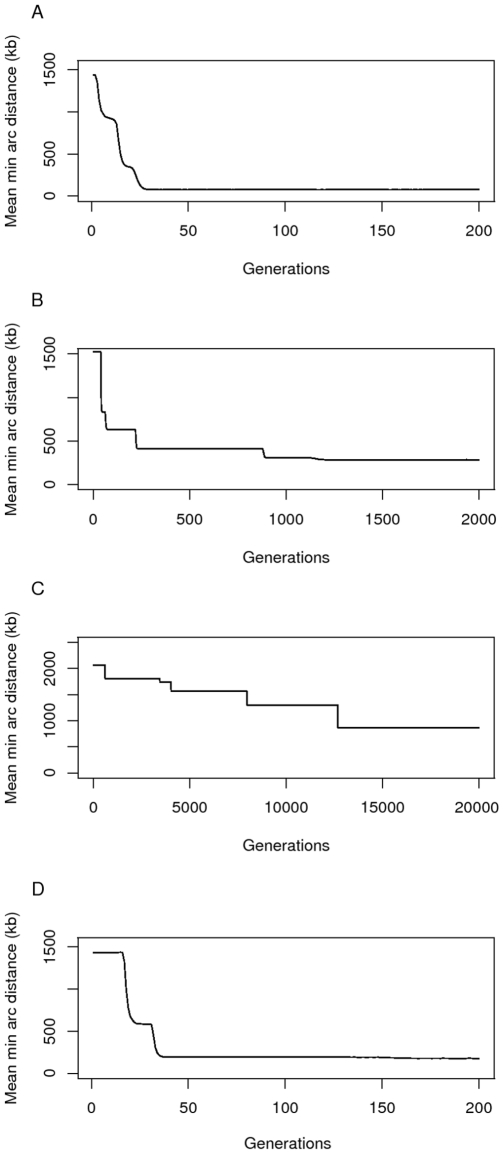
 (A and D),
  (B) and
  (C). The other parameters are
  and
and  genes. In panel D) a run of the simulation is shown in which we model selection for distance using a sigmoidal instead of exponential function. In this case, fitness decreases markedly between distances of 5 and 20kb. The final distance after 200 generations was 176 kb. Observe that in panel B) it took more than 10 times as long for the genes to approach a clustered state (distance 284 kb) than in panel A) (distance 77 kb), and that in panel C) the genes are still far apart at around 850 kb after 20,000 generations.
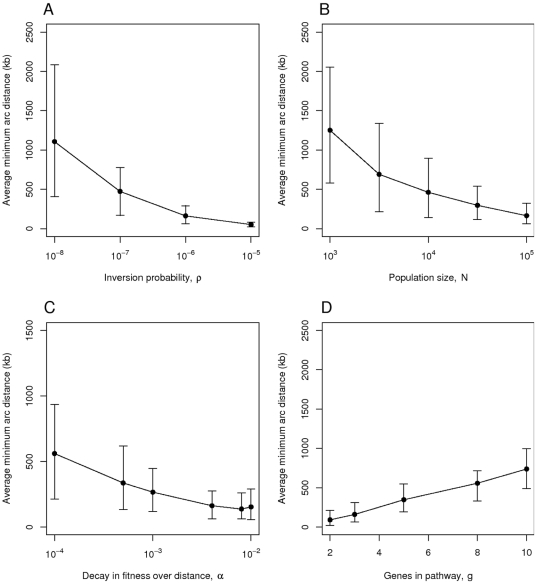
 , B) the population size
  , C) the decay in fitness over distance
  and D) the number of genes
  in the pathway in question. The default parameter values are
  ,
,  ,
,  and
and  . Simulations were run for 50,000 generations. Each point represents the mean from 100 simulations and the error bars indicate the central 90% of simulated values.
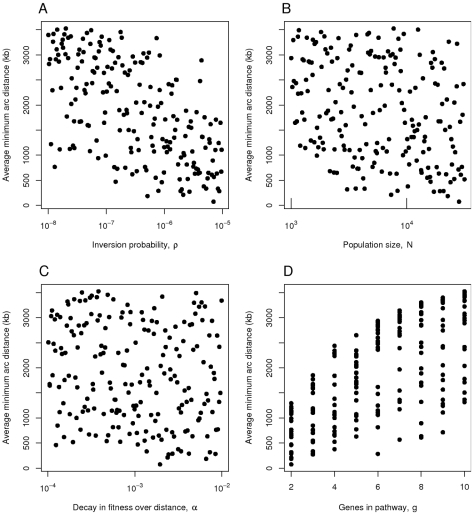
 , B) the population size
  , C) the decay in fitness over distance
  and D) the number of genes
  in the pathway in question. Simulations were run for 50,000 generations. Each point represents the mean from 100 simulations.
References
-
- Demerec M, Hartman PE. Complex loci in microorganisms. Annu Rev Microbiol. 1959;13:377–406.
-
- Bentley SD, Parkhill J. Comparative genomic structure of prokaryotes. Annu Rev Genet. 2004;38:771–791. - PubMed
-
- Jackson JH, Harrison SH, Herring PA. A theoretical limit to coding space in chromosomes of bacteria. OMICS. 2002;6:115–121. - PubMed
Publication types
MeSH terms
Substances
LinkOut - more resources
Full Text Sources
