

Minimization of biosynthetic costs in adaptive gene expression responses of yeast to environmental changes
- PMID: 20168993
- PMCID: PMC2820516
- DOI: 10.1371/journal.pcbi.1000674
Minimization of biosynthetic costs in adaptive gene expression responses of yeast to environmental changes
Abstract
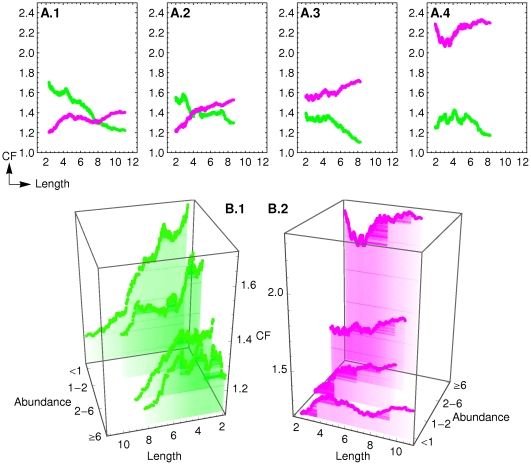
Yeast successfully adapts to an environmental stress by altering physiology and fine-tuning metabolism. This fine-tuning is achieved through regulation of both gene expression and protein activity, and it is shaped by various physiological requirements. Such requirements impose a sustained evolutionary pressure that ultimately selects a specific gene expression profile, generating a suitable adaptive response to each environmental change. Although some of the requirements are stress specific, it is likely that others are common to various situations. We hypothesize that an evolutionary pressure for minimizing biosynthetic costs might have left signatures in the physicochemical properties of proteins whose gene expression is fine-tuned during adaptive responses. To test this hypothesis we analyze existing yeast transcriptomic data for such responses and investigate how several properties of proteins correlate to changes in gene expression. Our results reveal signatures that are consistent with a selective pressure for economy in protein synthesis during adaptive response of yeast to various types of stress. These signatures differentiate two groups of adaptive responses with respect to how cells manage expenditure in protein biosynthesis. In one group, significant trends towards downregulation of large proteins and upregulation of small ones are observed. In the other group we find no such trends. These results are consistent with resource limitation being important in the evolution of the first group of stress responses.
Conflict of interest statement
The authors have declared that no competing interests exist.
Figures


Similar articles
-
Numerical methods for handling uncertainty in microarray data: an example analyzing perturbed mitochondrial function in yeast.Methods Cell Biol. 2001;65:439-52. doi: 10.1016/s0091-679x(01)65026-x. Methods Cell Biol. 2001. PMID: 11381609 No abstract available.
-
Comparative functional genomics of stress responses in yeasts.OMICS. 2010 Oct;14(5):501-15. doi: 10.1089/omi.2010.0029. Epub 2010 Aug 9. OMICS. 2010. PMID: 20695825 Review.
-
yMGV: helping biologists with yeast microarray data mining.Nucleic Acids Res. 2002 Jan 1;30(1):76-9. doi: 10.1093/nar/30.1.76. Nucleic Acids Res. 2002. PMID: 11752259 Free PMC article.
-
Genomic profiling of fungal cell wall-interfering compounds: identification of a common gene signature.BMC Genomics. 2015 Sep 5;16(1):683. doi: 10.1186/s12864-015-1879-4. BMC Genomics. 2015. PMID: 26341223 Free PMC article.
-
Nutritional genomics in yeast models.Nutrition. 2004 Jan;20(1):166-72. doi: 10.1016/j.nut.2003.09.026. Nutrition. 2004. PMID: 14698032 Review. No abstract available.
Cited by
-
Comparisons between Arabidopsis thaliana and Drosophila melanogaster in relation to Coding and Noncoding Sequence Length and Gene Expression.Int J Genomics. 2015;2015:269127. doi: 10.1155/2015/269127. Epub 2015 May 31. Int J Genomics. 2015. PMID: 26114098 Free PMC article.
-
Regulation of the Na+/K+-ATPase Ena1 Expression by Calcineurin/Crz1 under High pH Stress: A Quantitative Study.PLoS One. 2016 Jun 30;11(6):e0158424. doi: 10.1371/journal.pone.0158424. eCollection 2016. PLoS One. 2016. PMID: 27362362 Free PMC article.
-
Chlorobaculum tepidum Modulates Amino Acid Composition in Response to Energy Availability, as Revealed by a Systematic Exploration of the Energy Landscape of Phototrophic Sulfur Oxidation.Appl Environ Microbiol. 2016 Oct 14;82(21):6431-6439. doi: 10.1128/AEM.02111-16. Print 2016 Nov 1. Appl Environ Microbiol. 2016. PMID: 27565613 Free PMC article.
-
Yeast adaptation to weak acids prevents futile energy expenditure.Front Microbiol. 2013 Jun 11;4:142. doi: 10.3389/fmicb.2013.00142. eCollection 2013. Front Microbiol. 2013. PMID: 23781215 Free PMC article.
-
Queueing up for enzymatic processing: correlated signaling through coupled degradation.Mol Syst Biol. 2011 Dec 20;7:561. doi: 10.1038/msb.2011.94. Mol Syst Biol. 2011. PMID: 22186735 Free PMC article.
References
-
- Hohmann S, Mager W. Yeast Stress Responses. Heidelberg: Springer; 2003.
-
- Voit EO, Radivoyevitch T. Biochemical systems analysis of genome-wide expression data. Bioinformatics. 2000;16:1023–1037. - PubMed
-
- Ikemura T. Correlation between the abundance of yeast transfer RNAs and the occurrence of the respective codons in protein genes. Differences in synonymous codon choice patterns of yeast and Escherichia coli with reference to the abundance of isoaccepting transfer RNAs. J Mol Biol. 1982;158:573–597. - PubMed
-
- Karlin S, Mrazek J, Campbell AM. Codon usages in different gene classes of the Escherichia coli genome. Mol Microbiol. 1998;29:1341–1355. - PubMed
Publication types
MeSH terms
Substances
LinkOut - more resources
Full Text Sources
Molecular Biology Databases
