. 2010 Feb 16;5(2):e9225.
doi: 10.1371/journal.pone.0009225.

Visualizing interactions along the Escherichia coli twin-arginine translocation pathway using protein fragment complementation

Affiliations

Visualizing interactions along the Escherichia coli twin-arginine translocation pathway using protein fragment complementation

Jan S Kostecki et al. PLoS One. .

Abstract

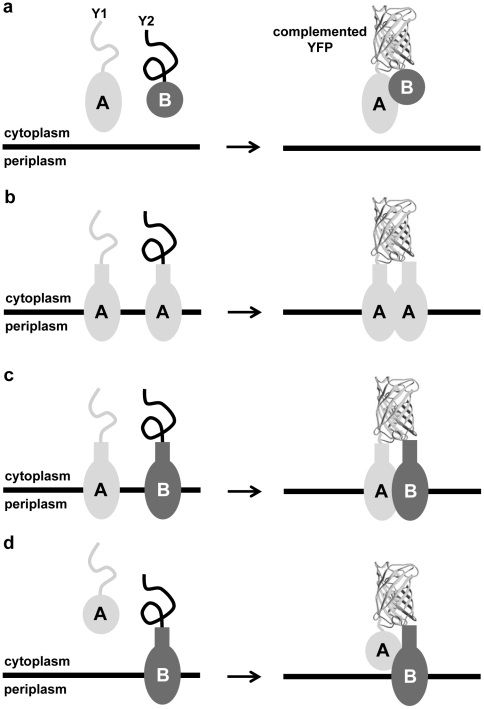
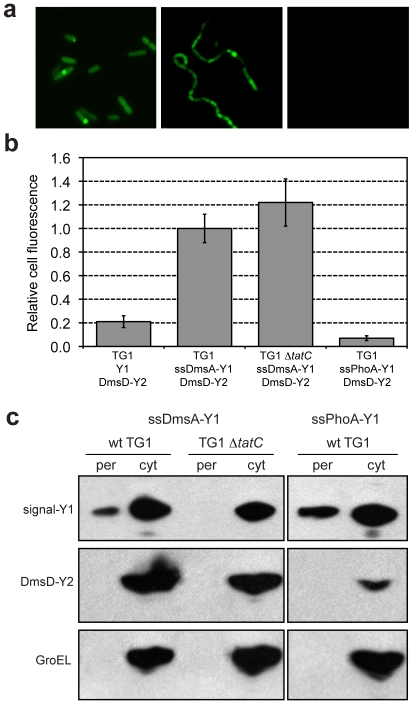
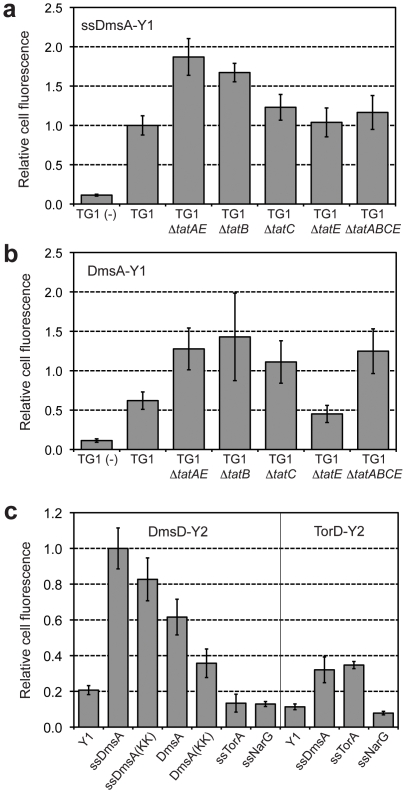
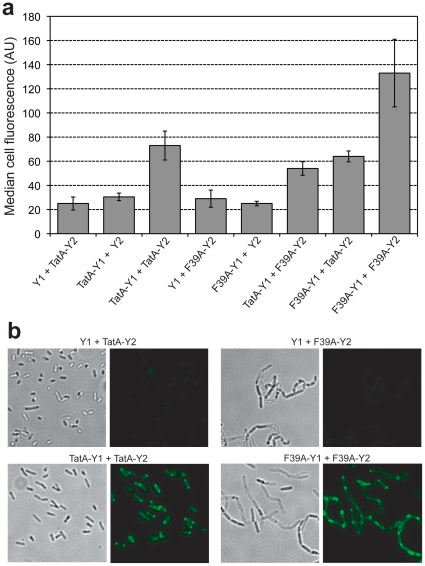
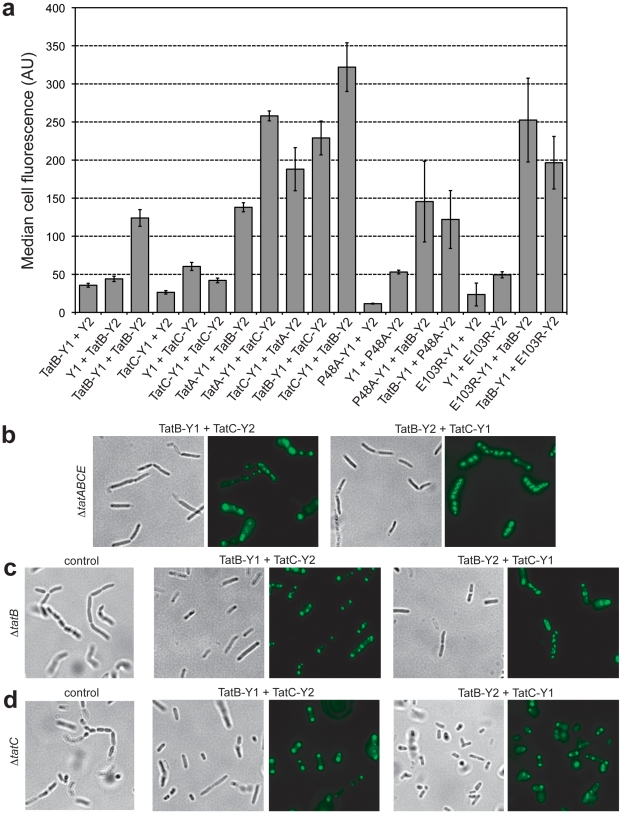
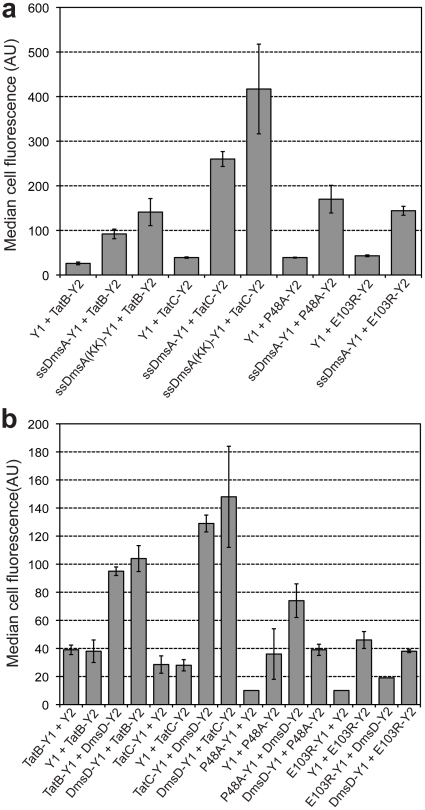
The twin-arginine translocation (Tat) pathway is well known for its ability to export fully folded substrate proteins out of the cytoplasm of gram-negative and gram-positive bacteria. Studies of this mechanism in Escherichia coli have identified numerous transient protein-protein interactions that guide export-competent proteins through the Tat pathway. To visualize these interactions, we have adapted bimolecular fluorescence complementation (BiFC) to detect protein-protein interactions along the Tat pathway of living cells. Fragments of the yellow fluorescent protein (YFP) were fused to soluble and transmembrane factors that participate in the translocation process including Tat substrates, Tat-specific proofreading chaperones and the integral membrane proteins TatABC that form the translocase. Fluorescence analysis of these YFP chimeras revealed a wide range of interactions such as the one between the Tat substrate dimethyl sulfoxide reductase (DmsA) and its dedicated proofreading chaperone DmsD. In addition, BiFC analysis illuminated homo- and hetero-oligomeric complexes of the TatA, TatB and TatC integral membrane proteins that were consistent with the current model of translocase assembly. In the case of TatBC assemblies, we provide the first evidence that these complexes are co-localized at the cell poles. Finally, we used this BiFC approach to capture interactions between the putative Tat receptor complex formed by TatBC and the DmsA substrate or its dedicated chaperone DmsD. Our results demonstrate that BiFC is a powerful approach for studying cytoplasmic and inner membrane interactions underlying bacterial secretory pathways.


Conflict of interest statement

Competing Interests: The authors have declared that no competing interests exist.

Figures

Figure 1
Figure 1. Protein interactions detected via BiFC along the Tat pathway of E. coli.
Splitting YFP into fragments Y1 and Y2 can be used to visualize interactions between: (a) two soluble cytoplasmic proteins; (b) a transmembrane protein with itself; (c) two different transmembrane proteins; and (d) a soluble cytoplasmic protein and a transmembrane protein.
Figure 2
Figure 2. BiFC illuminates DmsA-DmsD interaction.
(a) Fluorescence microscopy of wt TG1 cells expressing ssDmsA-Y1/DmsD-Y2 (left), TG1 ΔtatC cells expressing ssDmsA-Y1/DmsD-Y2 (center), and wt TG1 cells expressing ssPhoA-Y1/DmsD-Y2 (right). (b) Flow cytometric analysis of cells expressing constructs as indicated. Median fluorescence was obtained for each cell population and normalized to the median fluorescence measured for TG1 cells expressing ssDmsA-Y1/DmsD-Y2 (median fluorescence value for this interaction was M = 2247). Data was reported as the average of 6 replicate experiments (n = 6) and error bars represent the standard error of the mean (sem). (c) Western blot analysis of periplasmic (per) and cytoplasmic (cyt) fractions from wt TG1 or TG1 ΔtatC cells expressing ssDmsA-Y1/DmsD-Y2 or ssPhoA-Y1/DmsD-Y2 as indicated. YFP1 was detected by virtue of a C-terminal FLAG tag using anti-FLAG antibody. YFP2 and GroEL proteins were detected using anti-GFP or anti-GroEL antibodies, respectively.
Figure 3
Figure 3. Specificity determinants of substrate/chaperone interactions.
Co-expression of (a) ssDmsA-Y1/DmsD-Y2 or (b) DmsA-Y1/DmsD-Y2 in various TG1 tat deletion strains as indicated. TG1 (−) indicates cells that co-expressed Y1 lacking the ssDmsA signal peptide and DmsD-Y2. Median cell fluorescence was obtained via flow cytometry and normalized to that for wt TG1 cells co-expressing ssDmsA-Y1/DmsD-Y2. Data was reported as the average of 6 replicate experiments (n = 6) and error bars represent the sem. (c) Co-expression of DmsD-Y2 with wt ssDmsA-Y1, full-length DmsA-Y1, or twin-lysine (KK) variants of ssDmsA-Y1 or DmsA-Y1 in a wt TG1 background. Chaperones DmsD and TorD each fused to Y2 were co-expressed with their cognate or non-cognate signal sequences (ssDmsA-Y1, ssTorA-Y1, ssNarG-Y1). Median cell fluorescence was obtained via flow cytometry and normalized to that for wt TG1 cells co-expressing ssDmsA-Y1/DmsD-Y2. Data was reported as the average of 6 replicate experiments (n = 6) and error bars represent the sem.
Figure 4
Figure 4. Visualizing the formation of TatA homo-oligomers.
(a) Cell fluorescence of TG1 ΔtatABCE cells expressing TatA-Y1, TatA-Y2, F39A-Y1, F39A-Y2, and the negative controls Y1 or Y2. Median fluorescence values were obtained via flow cytometric analysis and reported as the average of 3 replicate measurements (n = 3). Error bars represent the sem. (b) Bright field illumination and fluorescence microscopy for phenotypic analysis of chain complementation and fluorescence localization in TG1 ΔtatAE cells expressing various TatA chimeras as indicated.
Figure 5
Figure 5. Assembly of fluorescent TatBC homo- and hetero-oligomers.
(a) Cell fluorescence of TG1 ΔtatABCE cells expressing TatB and TatC BiFC chimeras as indicated. In addition to wt TatC, the TatC variants P48A and E103R were also evaluated. Unfused Y1 and Y2 constructs co-expressed with TatB or TatC chimeras served as negative controls. Median fluorescence values were obtained via flow cytometric analysis and reported as the average of 3 replicate measurements (n = 3). Error bars represent the sem. Bright field illumination and fluorescence microscopy for (b) TG1 ΔtatABCE, (c) TG1 ΔtatB and (d) TG1 ΔtatC cells co-expressing TatB-Y1/TatC-Y2 or TatB-Y2/TatC-Y2 as indicated. Also shown are plasmid-free TG1 ΔtatB and ΔtatC cells (control) to illustrate the chain phenotype of Tat-deficient mutants.
Figure 6
Figure 6. BiFC reveals substrate and chaperone “docking” on TatB or TatC.
(a) Cell fluorescence of TG1 ΔtatABCE cells co-expressing ssDmsA-Y1 with either TatB-Y2 or TatC-Y2 as indicated. Also shown are data for the ssDmsA twin-lysine (KK) variant and the TatC variants P48A and E103R. (b) TG1 ΔtatABCE cells co-expressing DmsD with either TatB or TatC chimeras as indicated. Unfused Y1 and Y2 constructs co-expressed with TatB or TatC chimeras served as negative controls. Median fluorescence values were obtained via flow cytometric analysis and reported as the average of 3 replicate measurements (n = 3). Error bars represent the sem.

Similar articles

Cited by

References

    1. Pugsley AP. The complete general secretory pathway in gram-negative bacteria. Microbiol Rev. 1993;57:50–108. - PMC - PubMed
    1. Mori H, Ito K. The Sec protein-translocation pathway. Trends Microbiol. 2001;9:494–500. - PubMed
    1. Driessen AJ, Fekkes P, van der Wolk JP. The Sec system. Curr Opin Microbiol. 1998;1:216–22. - PubMed
    1. Driessen AJ, Manting EH, van der Does C. The structural basis of protein targeting and translocation in bacteria. Nat Struct Biol. 2001;8:492–8. - PubMed
    1. Schatz G, Dobberstein B. Common principles of protein translocation across membranes. Science. 1996;271:1519–26. - PubMed

Publication types

MeSH terms

Grants and funding