. 2010 Feb 16;5(2):e9239.
doi: 10.1371/journal.pone.0009239.

Carboxy terminal tail of polycystin-1 regulates localization of TSC2 to repress mTOR

Affiliations

Carboxy terminal tail of polycystin-1 regulates localization of TSC2 to repress mTOR

Ruhee Dere et al. PLoS One. .

Abstract

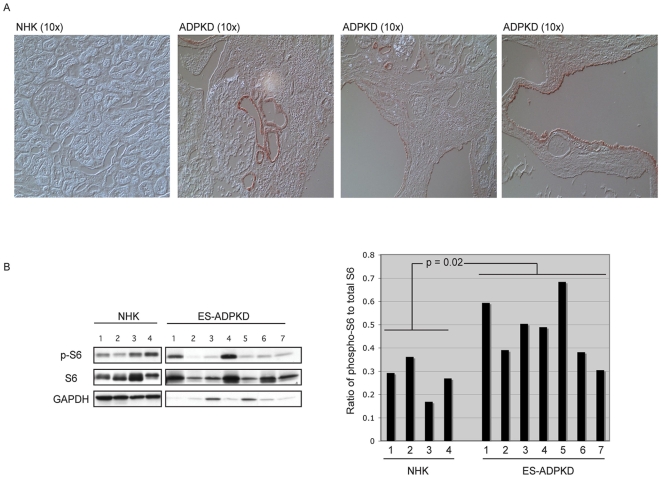
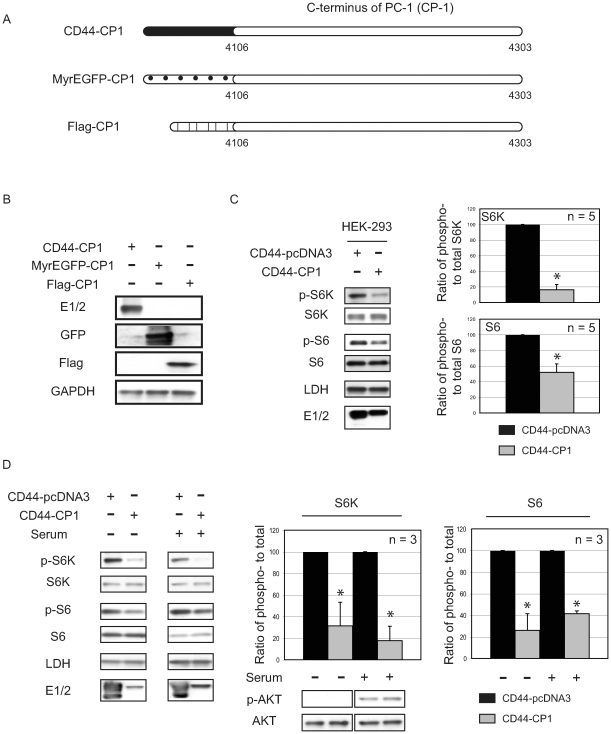
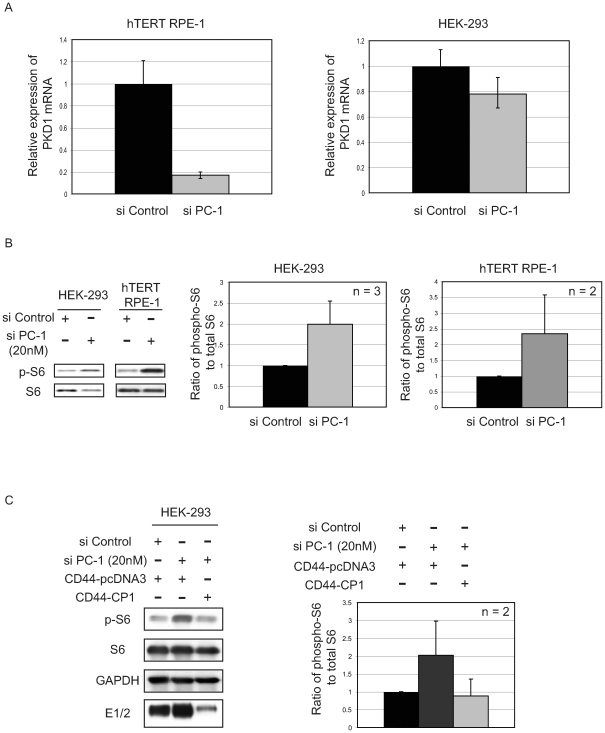
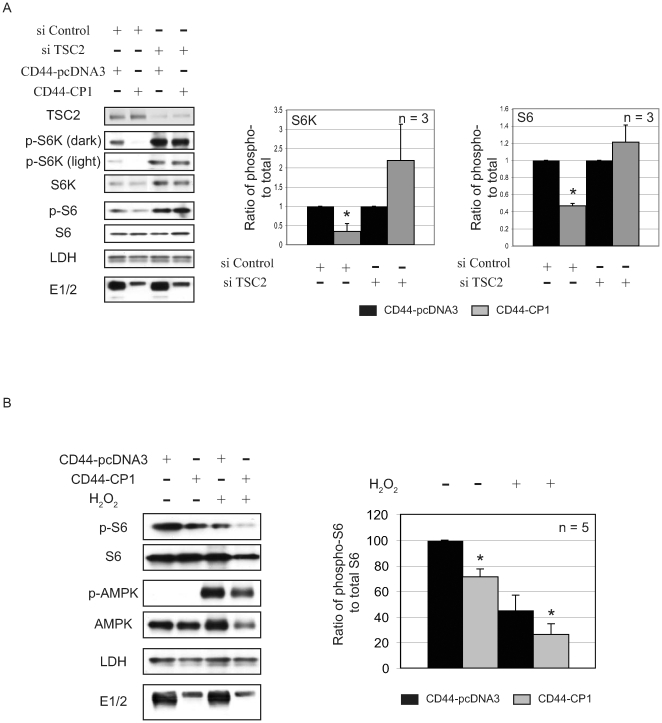
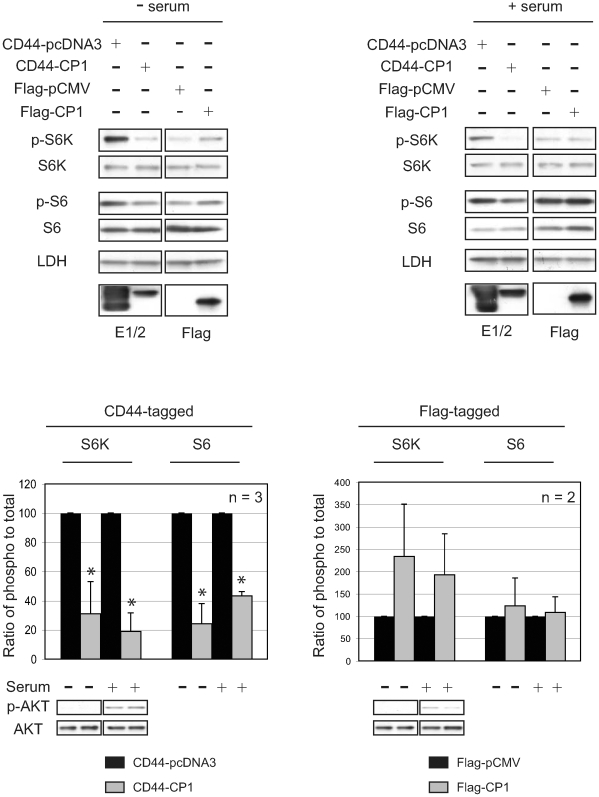
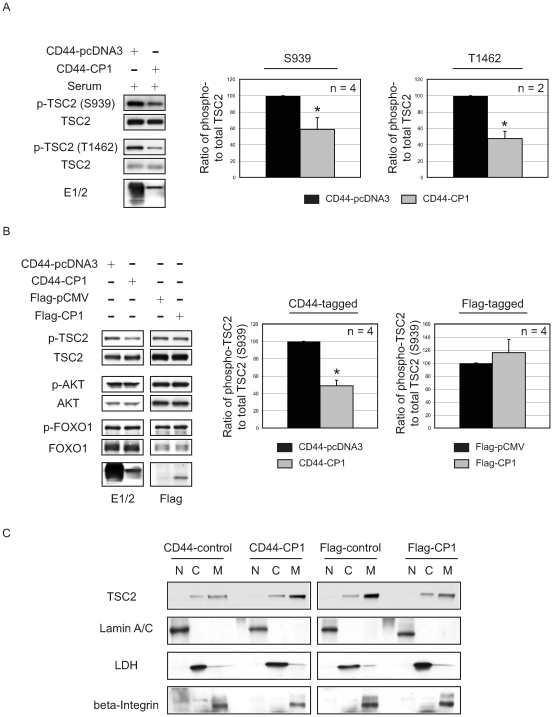
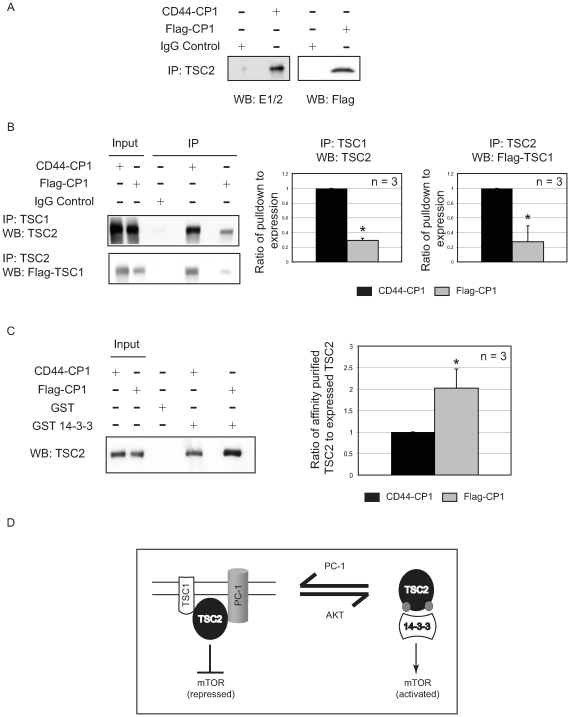
Autosomal dominant polycystic kidney disease (ADPKD) is a commonly inherited renal disorder caused by defects in the PKD1 or PKD2 genes. ADPKD is associated with significant morbidity, and is a major underlying cause of end-stage renal failure (ESRF). Commonly, treatment options are limited to the management of hypertension, cardiovascular risk factors, dialysis, and transplantation when ESRF develops, although several new pharmacotherapies, including rapamycin, have shown early promise in animal and human studies. Evidence implicates polycystin-1 (PC-1), the gene product of the PKD1 gene, in regulation of the mTOR pathway. Here we demonstrate a mechanism by which the intracellular, carboxy-terminal tail of polycystin-1 (CP1) regulates mTOR signaling by altering the subcellular localization of the tuberous sclerosis complex 2 (TSC2) tumor suppressor, a gatekeeper for mTOR activity. Phosphorylation of TSC2 at S939 by AKT causes partitioning of TSC2 away from the membrane, its GAP target Rheb, and its activating partner TSC1 to the cytosol via 14-3-3 protein binding. We found that TSC2 and a C-terminal polycystin-1 peptide (CP1) directly interact and that a membrane-tethered CP1 protects TSC2 from AKT phosphorylation at S939, retaining TSC2 at the membrane to inhibit the mTOR pathway. CP1 decreased binding of 14-3-3 proteins to TSC2 and increased the interaction between TSC2 and its activating partner TSC1. Interestingly, while membrane tethering of CP1 was required to activate TSC2 and repress mTOR, the ability of CP1 to inhibit mTOR signaling did not require primary cilia and was independent of AMPK activation. These data identify a unique mechanism for modulation of TSC2 repression of mTOR signaling via membrane retention of this tumor suppressor, and identify PC-1 as a regulator of this downstream component of the PI3K signaling cascade.


Conflict of interest statement

Competing Interests: The authors have declared that no competing interests exist.

Figures

Figure 1
Figure 1. Dysregulation of mTOR in human ADPKD patients.
A. Normal human kidney (NHK) and ES-ADPKD kidney tissues were analyzed by immunohistochemistry using anti-phospho-S6 antibody (stained red). The sections were visualized using Differential Interference Contrast (DIC) microscopy. Representative images at 10x magnification are shown. B. Western blot analysis of tissue lysates from 4 NHK and 8 ES-ADPKD kidneys, immunoblotted with anti-phospho-S6 antibody (left). The autoradiographs were quantified and plotted as a ratio of phosphorylated S6 to total S6 (right). A statistically significant (p≤0.05) increase in phosphorylation of S6 was observed in ES-ADPKD kidneys compared to the NHKs.
Figure 2
Figure 2. The C-terminal tail of human polycystin-1 (CP1) represses mTOR signaling.
A. Schematic of the constructs used in the study. CP1 (aa 4106 – aa 4303) was tagged with either membrane-bound CD44, myristolylated EGFP or soluble Flag tag. B. Expression of the tagged-CP1 constructs transfected into HEK-293 cells was determined by immunoblotting using E1/2, anti-GFP and anti-Flag antibodies. C. Protein lysates generated from HEK-293 cells (n = 5) expressing CD44-pcDNA3 (vector control) or CD44-CP1 were analyzed using the indicated antibodies (left). The autoradiographs were quantified and plotted as a ratio of phospho- to total protein (S6K and S6), where the vector control (CD44-pcDNA3, black bars) and CD44-CP1 (gray bars) were normalized to 100. D. HEK-293 cells were transfected with the vector control (CD44-pcDNA3) or CD44-CP1 and treated as indicated (n = 3). Protein lysates generated from these cells were analyzed by immunoblotting using the indicated antibodies (left). The graphs denote the ratio of phospho- to total protein (S6K and S6) (right) where the vector control (CD44-pcDNA3, black bars) and CD44-CP1 (gray bars) ratios were normalized to 100. All blots shown are indicative of a single representative experiment and an * denotes a statistically significant difference (p≤0.05) between vector control (CD44-pcDNA3) and CD44-CP1.
Figure 3
Figure 3. Polycystin-1 knockdown results in the activation of mTOR signaling in vitro.
A. RT-PCR analysis of mRNA collected from hTERT RPE-1 and HEK-293 cells expressing human PC-1 siRNA (20 nM). The relative expression of PC-1 is shown in the presence of scrambled (control, black bars) and human PC-1 (gray bars) siRNA, normalized to 1. All RT-PCR reactions were performed in triplicate. B. Cell lysates collected from HEK-293 and hTERT RPE-1 cells 48 hours following transfection of scrambled and PC-1 siRNA were examined by immunoblotting using the specified antibodies (left). The blots shown indicate a single representative experiment. The graphs (right) indicate the ratio of phospho- to total S6 where the scrambled (black bars) and PC-1 siRNA (gray bars) ratios were normalized to 1. C. Protein lysates from HEK-293 and hTERT RPE-1 cells, transfected with control or human PC-1 siRNA and co-expressing CD44-pcDNA3 (vector control) or CD44-CP1, were analyzed by immunoblotting using the indicated antibodies (left). The western blots are representative of two independent experiments. The autoradiographs were quantified and plotted (right) as a ratio of phospho- to total S6. The control siRNA (with CD44-pcDNA3) is depicted as a black bar and PC-1 siRNA with either CD44-pcDNA3 or CD44-CP1 is shown as gray bars.
Figure 4
Figure 4. CP1 inhibits mTOR via a TSC2-dependent mechanism, distinct from AMPK activation of TSC2.
A. HEK-293 cells transfected with scrambled or TSC2 siRNA, co-expressing CD44-pcDNA3 or CD44-CP1 were used to generate protein lysates that were analyzed by immunoblotting using the indicated antibodies. Blots represent a single experiment (n = 3) and the graph is a ratio of phospho- to total protein. The ratios for CD44-pcDNA3 (vector control, black bars) and CD44-CP1 (gray bars) were normalized to 1 as shown. B. Protein lysates generated from HEK-293 cells expressing CD44-pcDNA3 (control) or CD44-CP1, treated with 0.4 mM H2O2 were analyzed by immunoblotting with the indicated antibodies. The autoradiographs were quantified and plotted as a ratio of phospho-S6 to total S6 for the conditions indicated. Representative blots for a single experiment are shown (n = 5). The * denotes a statistically significant difference between the vector control (CD44-pcDNA3, black bars) and CD44-CP1 (gray bars) (p≤0.05).
Figure 5
Figure 5. Membrane tethering of CP1 is required for its regulation of mTOR.
HEK-293 cells were transfected with CD44-pcDNA3 (vector control), CD44-CP1, Flag-pCMV (vector control) or Flag-CP1 and treated as indicated. Protein lysates were analyzed by immunoblotting with the indicated antibodies (left). The graphs indicate the ratios of phospho- to total protein for the vector controls (CD44-pcDNA3 or Flag-pCMV, black bars) and CD44-CP1 or Flag-CP1 (gray bars). Blots represent a single experiment (n = 3 with CD44-tagged constructs, and n = 2 with Flag-tagged constructs) under the indicated conditions and the ratios were normalized to 100. An * denotes a statistically significant (p≤0.05) difference between CD44-CP1 compared to its vector control (CD44-pcDNA3).
Figure 6
Figure 6. CP1 represses mTOR, by protecting TSC2 from its inactivating phosphorylation by AKT.
A. Cell lysates obtained from HEK-293 cells expressing CD44-pcDNA3 (vector control) and CD44-CP1, treated with serum for 1h following serum starvation, were immunoblotted using the indicated antibodies. Blots from a single representative experiment are shown for phosphorylation at S939 (n = 4) and T1462 (n = 2). The graph on the right indicates the ratio of phospho- to total TSC2 at residues S939 and T1462. An * denotes a statistically significant difference between vector control (CD44-pcDNA3, black bars) and CD44-CP1 (gray bars) (p≤0.05). B. Cell lysates obtained from HEK-293 cells grown in normal growth media containing 10% FBS, and expressing CD44-pcDNA3 (vector control), CD44-CP1, Flag-pCMV (vector control) or Flag-CP1 were analyzed using the indicated antibodies. Blots from a single representative experiment are shown (n = 4). The graph on the right denotes the ratio of phospho- to total TSC2 (S939) for both CD44-tagged and Flag-tagged constructs. Black bars indicate the controls whereas the gray bars indicate either CD44-CP1 or Flag-CP1. The * denotes a statistically significant difference between CD44-pcDNA3 (vector control) and CD44-CP1 (p≤0.001). C. Subcellular fractionation of HEK-293 cells expressing CD44-pcDNA3 (vector control), CD44-CP1, Flag-pCMV (vector control), or Flag-CP1. A representative blot (n = 3) showing the separated fractions analyzed using anti-TSC2, anti-lamin A/C (nuclear maker), anti-LDH (cytosolic marker), and anti-beta-integrin (membrane marker). N – nuclear, C – cytosolic, M – membrane fraction.
Figure 7
Figure 7. Interaction of tuberin with hamartin and 14-3-3 in cells expressing functional and non-functional CP1.
A. Lysates generated from HEK-293 cells, expressing functional, membrane-bound CD44-CP1 and non-functional, soluble Flag-CP1, were used for immunoprecipitation with anti-TSC2 and the immunoprecipitates further analyzed by immunoblotting with E1/2 and anti-Flag antibodies. B. Whole cell lysates from HEK-293 cells expressing either CD44-CP1 or Flag-CP1 were used for immunoprecipitation with anti-TSC2 or anti-TSC1 antibodies, and the immunoprecipitates analyzed by immunoblotting with anti-Flag (to detect Flag-TSC1), or anti-TSC2, respectively. Blots from a single representative experiment are shown (n = 3). The graph on the right shows the ratio of pull down to the expression of Flag-TSC1 and TSC2 as indicated. Quantification of blots from both immunoprecipitation assays showed a statistically significant difference (*) in the interaction between TSC2 and TSC1, in cells expressing CD44-CP1 (black bars) and Flag-CP1 (gray bars). C. Protein lysates from HEK-293 cells expressing CD44-CP1 or Flag-CP1 were affinity purified using GST-14-3-3 or GST alone and immunoblotted with an anti-TSC2 antibody. The immunoblot for a single representative experiment is shown (n = 3). The graph on the right depicts the ratio of affinity-purified TSC2 to total endogenous TSC2 in cells expressing CD44-CP1 (black bar) or Flag-CP1 (gray bar) and the * denotes a statistically significant difference between the two. D. Model for polycystin-1 inhibition of mTOR signaling via TSC2.

Similar articles

Cited by

References

    1. Wilson PD. Polycystic kidney disease: new understanding in the pathogenesis. Int J Biochem Cell Biol. 2004;36:1868–1873. - PubMed
    1. Chang MY, Ong AC. Autosomal dominant polycystic kidney disease: recent advances in pathogenesis and treatment. Nephron Physiol. 2008;108:1–7. - PubMed
    1. Igarashi P, Somlo S. Genetics and pathogenesis of polycystic kidney disease. J Am Soc Nephrol. 2002;13:2384–2398. - PubMed
    1. Wilson PD, Goilav B. Cystic disease of the kidney. Annu Rev Pathol. 2007;2:341–368. - PubMed
    1. Torres VE, Harris PC, Pirson Y. Autosomal dominant polycystic kidney disease. Lancet. 2007;369:1287–1301. - PubMed

Publication types

MeSH terms

Substances