. 2010 Feb 16;5(2):e9252.
doi: 10.1371/journal.pone.0009252.

Mouse bone marrow-derived mesenchymal stromal cells turn activated macrophages into a regulatory-like profile

Affiliations

Mouse bone marrow-derived mesenchymal stromal cells turn activated macrophages into a regulatory-like profile

Julian Maggini et al. PLoS One. .

Abstract

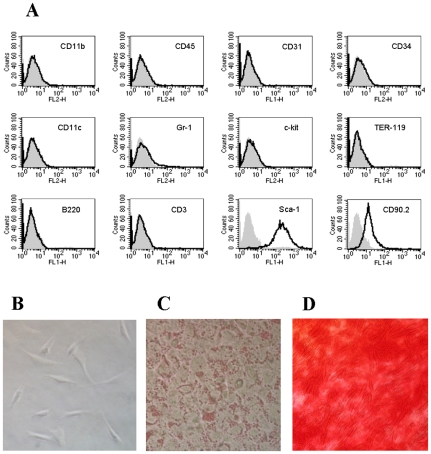
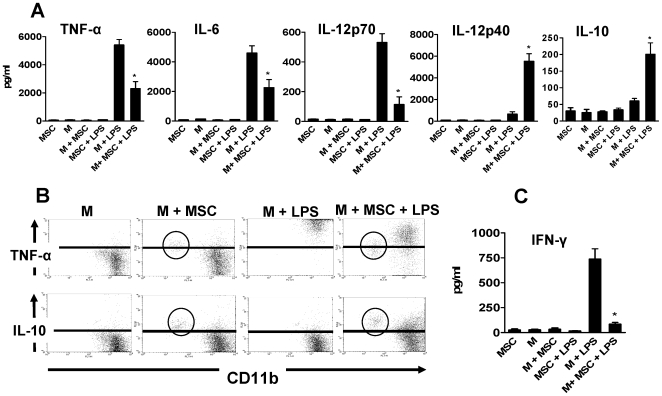
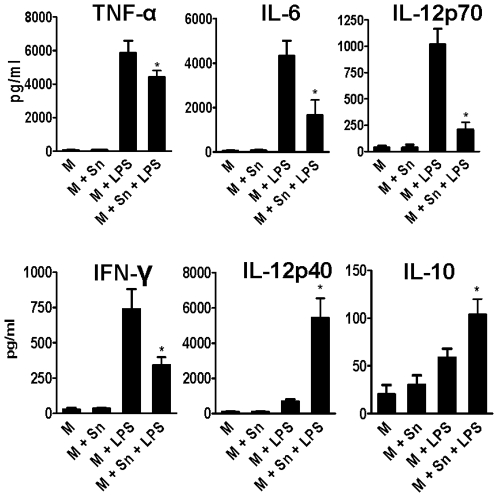
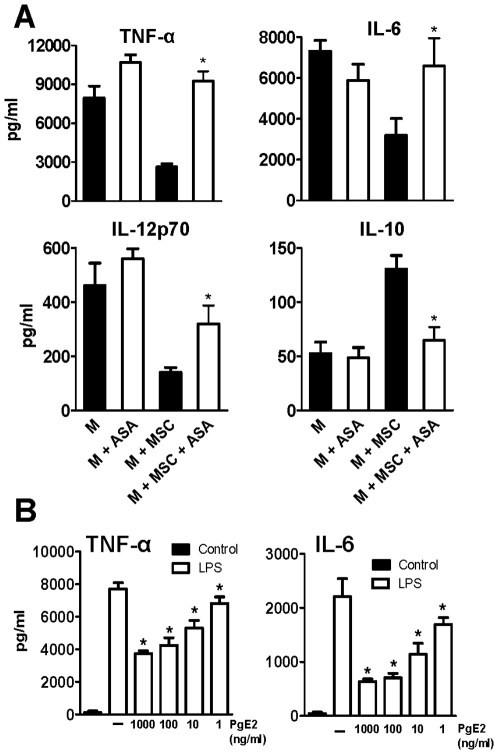
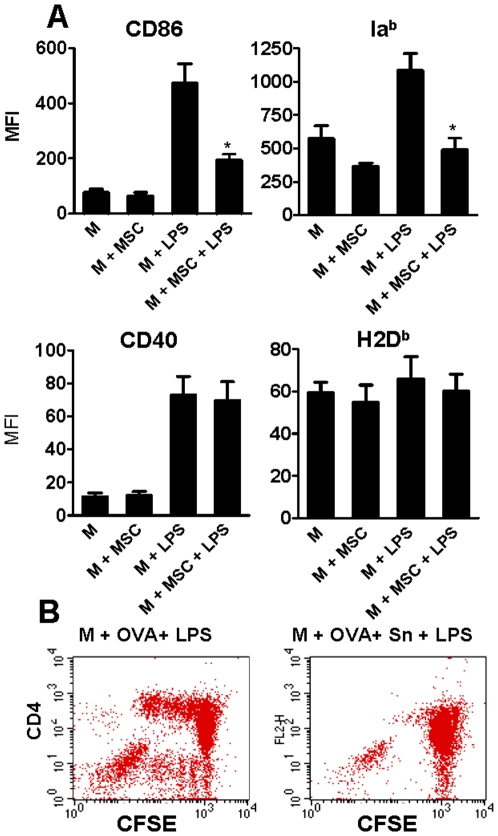
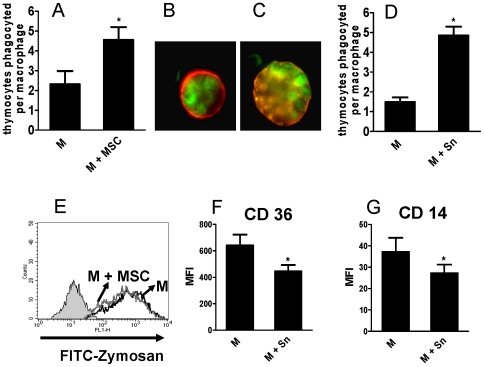
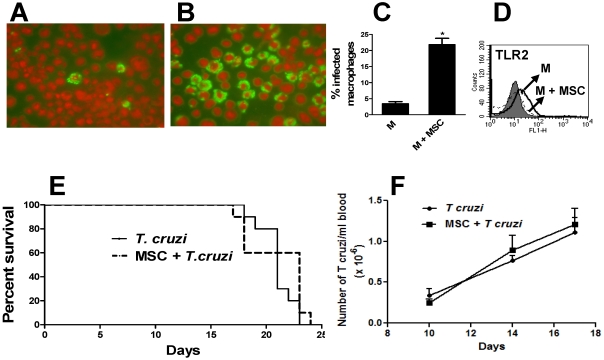
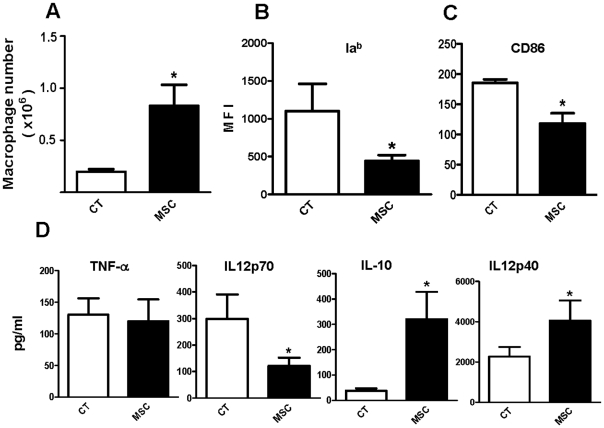
In recent years it has become clear that the therapeutic properties of bone marrow-derived mesenchymal stromal cells (MSC) are related not only to their ability to differentiate into different lineages but also to their capacity to suppress the immune response. We here studied the influence of MSC on macrophage function. Using mouse thioglycolate-elicited peritoneal macrophages (M) stimulated with LPS, we found that MSC markedly suppressed the production of the inflammatory cytokines TNF-alpha, IL-6, IL-12p70 and interferon-gamma while increased the production of IL-10 and IL-12p40. Similar results were observed using supernatants from MSC suggesting that factor(s) constitutively released by MSC are involved. Supporting a role for PGE(2) we observed that acetylsalicylic acid impaired the ability of MSC to inhibit the production of inflammatory cytokines and to stimulate the production of IL-10 by LPS-stimulated M. Moreover, we found that MSC constitutively produce PGE2 at levels able to inhibit the production of TNF-alpha and IL-6 by activated M. MSC also inhibited the up-regulation of CD86 and MHC class II in LPS-stimulated M impairing their ability to activate antigen-specific T CD4+ cells. On the other hand, they stimulated the uptake of apoptotic thymocytes by M. Of note, MSC turned M into cells highly susceptible to infection with the parasite Trypanosoma cruzi increasing more than 5-fold the rate of M infection. Using a model of inflammation triggered by s.c. implantation of glass cylinders, we found that MSC stimulated the recruitment of macrophages which showed a low expression of CD86 and the MHC class II molecule Ia(b) and a high ability to produce IL-10 and IL-12p40, but not IL-12 p70. In summary, our results suggest that MSC switch M into a regulatory profile characterized by a low ability to produce inflammatory cytokines, a high ability to phagocyte apoptotic cells, and a marked increase in their susceptibility to infection by intracellular pathogens.


Conflict of interest statement

Competing Interests: The authors have declared that no competing interests exist.

Figures

Figure 1
Figure 1. Characterization of bone marrow-derived mesenchymal stromal cells (MSC).
MSC were isolated from bone marrow of adult C57BL/6J and cultured using standard protocols. (A) Analysis of the phenotype of MSC by flow cytometry. Grey histograms represent isotype controls (B) Morphology of MSC. (C) Culture of MSC in adipocyte-differentiation media showing cells containing drops of fat revealed by Oil Red O. (D) Culture of MSC in osteogenic-differentiation media showing the formation of calcium containing precipitates stained by Alizarin Red S. A representative experiment is shown.
Figure 2
Figure 2. MSC inhibit the production of inflammatory cytokines and enhance the production of IL-10 by thioglycolate-elicited peritoneal macrophages (M).
M were cultured overnight in the absence or presence of MSC (M: MSC ratio = 10∶1). Cells were then washed and incubated for 18 h with or without LPS (30 ng/ml), and cytokines were analyzed in cell-supernatants by ELISA (A and C) or by intracellular staining and flow cytometry (B). (A and C) Results are expressed in pg/ml and represent the arithmetic mean ± SEM of 5–6 experiments. (B) Representative dot-plots (n = 4) are shown. Inside the circle MSC. *, p<0.05 for M+MSC+LPS vs M+LPS.
Figure 3
Figure 3. MSC regulate the profile of cytokines produced by activated M through the release of soluble factor(s).
MSC grown to confluence were cultured alone for 24 h and the cell-supernatants were then harvested. M were cultured for 18 h with or without LPS (30 ng/ml) in the absence or presence of MSC supernatants (50% V/V) and cytokines were analyzed in cell-supernatants by ELISA. Results are expressed in pg/ml and represent the arithmetic mean ± SEM of 5 experiments. *, p<0.05 for M+Sn+LPS vs M+LPS.
Figure 4
Figure 4. Acetylsalicylic acid (ASA) impairs the ability of MSC to modulate the profile of cytokines produced by M.
(A) M were cultured overnight in the absence or presence of MSC (M: MSC ratio = 10∶1) with or without ASA (0.5 mM). Cells were then washed and incubated for 18 h with LPS (30 ng/ml), in the absence or presence of ASA (0.5 mM) and cytokines were analyzed in cell-supernatants by ELISA. (B) M were cultured overnight in the absence (controls) or presence of different concentrations of PGE2. Then, cells were incubated for 18 h with LPS (30 ng/ml) and cytokines were analyzed in cell-supernatants by ELISA. Results are expressed in pg/ml and represent the arithmetic mean ± SEM of 4–5 experiments. *, p<0.05 for M+MSC+ASA vs M+MSC, and for M+LPS+PGE2 vs M+LPS.
Figure 5
Figure 5. MSC inhibit the up-regulation of CD86 and MHC class II (Iab) in M stimulated by LPS and impairs antigen presentation to T CD4+ cells.
(A) M were cultured overnight in the absence or presence of MSC (M: MSC ratio = 10∶1). Cells were then washed and incubated for 18 h with or without LPS (30 ng/ml), and the expression of CD86, MHC class II (Iab), CD40 and MHC class I (H2Db) in M was analyzed using FITC-labeled antibodies directed to CD11b and PE-labeled antibodies directed to CD86, Iab, CD40, and H2Db, in the gate of CD11b-positive cells. Results are expressed as the mean fluorescence intensity (MFI) values and represent the arithmetic mean ± SEM of 4-5 experiments. *, p<0.05 for M+MSC+LPS vs M+LPS. (B) M (1x10⁵ cells/100 µl) were cultured overnight in 96 well-flat bottom plates with culture medium alone or MSC-conditioned medium (50% V/V). After washing, cells were treated with LPS (30 ng/ml) in the presence of OVA (500 µg/ml) for 18 hs. After this period, M were washed and fresh culture medium was added. Spleen T CD4+ cells from OT-II mice were purified and labeled with CFSE, as described under Materials and Methods. Macrophages and CFSE-labeled OT-II T CD4+ cells were cultured together (M∶T cell ratio 1∶5) for 72 h. Cells were stained with PE-labeled anti-CD4 mAb, and the proliferation of the CFSE-labeled T CD4+ cells was analyzed by flow cytometry. A representative experiment is shown (n = 5). No proliferation was observed when LPS-stimulated M were cultured without OVA.
Figure 6
Figure 6. MSC stimulate the uptake of apoptotic thymocytes by M.
M were cultured overnight in the absence or presence of MSC (M: MSC ratio 10∶1). Apoptotic thymocytes labeled with CFSE were then added (M: thymocyte ratio = 1∶10), and cells were incubated for 1 h at 37°C. The number of apoptotic thymocytes inside each macrophage was analyzed by fluorescence microscopy using PE-labeled IgG anti-CD11b. At least 200 macrophages were scored in each experiment. (A) Results are expressed as the number of thymocytes internalized per macrophage and represent the arithmetic mean ± SEM of five experiments. *, p<0.05 for M+MSC vs M. (B) Representative images of phagocytosis of apoptotic thymocytes by M cultured alone (B) or in the presence of MSC (C). (D) MSC grown to confluence were cultured alone for 24 h and the cell-supernatants were then harvested. M were cultured overnight with or without MSC supernatants (50% V/V). Apoptotic thymocytes labeled with CFSE were then added (M: thymocyte ratio = 1∶10), and cells were incubated for 1 h at 37°C. The number of apoptotic thymocytes inside each macrophage was analyzed as described above. Results represent the arithmetic mean ± SEM of four experiments. *, p<0.05 for M+Sn vs M. (E) M were cultured overnight in the absence or presence of MSC (M: MSC ratio 10∶1). FITC-labeled zymosan particles (250 µ/ml) were then added and phagocytosis was evaluated after 1 h of incubation at 37°C, using PE-labeled IgG anti-CD11b and flow cytometry, in the gate of CD11b-positive cells. Grey histogram represents the fluorescence of M cultured without zymosan particles. It was similar for M cultured in the absence or presence of MSC. A representative experiment (n = 4) is shown. (F and G) MSC grown to confluence were cultured alone for 24 h and the cell-supernatants were then harvested. M were cultured overnight with or without MSC supernatants (50% V/V). Cells were washed and the expression of CD36 and CD14 was analyzed by flow cytometry. Results are expressed as the mean fluorescence intensity (MFI) values and represent the arithmetic mean ± SEM of 4 experiments. *, p<0.05 for M+Sn vs M.
Figure 7
Figure 7. MSC turn M into cells highly susceptible to T. cruzi infection.
M were cultured overnight in the absence or presence of MSC (M: MSC ratio 10∶1). T. cruzi trypomastigotes (M: T. cruzi ratio = 1∶5) were then added and incubated for 3 h. Cells were then washed, and cultured for 45 h. Finally, cells were fixed, permeabilized, stained and the presence of intracellular amastigotes was analyzed by fluorescence microscopy as described under Materials and Methods. (A and B) Representative images of intracellular amastigotes in M cultured overnight in the absence (A) or presence (B) of MSC. (C) Results are expressed as the percentage of infected macrophages and represent the arithmetic mean ± SEM of five experiments. *, p<0.05 for M+MSC vs M. (D) M were cultured overnight in the absence or presence of MSC (M: MSC ratio 10∶1). Cells were then washed and the expression of TLR2 in M was analyzed using PE-labeled antibodies directed to TLR2, in the gate of CD11b(FITC)-positive cells. Grey histogram represents the isotype control. A representative experiment (n = 4) is shown. (E and F) Two-months old C57Bl/6 female mice were infected by intraperitoneal (IP) route with 1×10⁵ bloodstream trypomastigotes of the lethal pantropic/reticulotropic RA strain of T. cruzi. MSC (2.5×10⁶/500 µl pyrogen-free PBS) or PBS (controls) were inoculated by intraperitoneal route at days 4 and 10 post-infection. (F) Parasitemia was measured at days 8, 14, and 17 post-infection and the results are expressed as the number of T cruzi/ml blood (n = 10 for each experimental group). (E) Mouse deaths were recorded on a daily basis. Results are expressed as survival percent (n = 10 for each experimental group).
Figure 8
Figure 8. MSC stimulate “in vivo” the recruitment of macrophages and direct their differentiation into a regulatory-like profile.
A Glass cylinder of 2 cm long, 8 mm wide and around 200 µl internal volume was implanted s.c. into 8-to 12-week-old C57BL/6 mice. Two and 7 days after the cylinders were implanted in the mice, 2×10⁵ MSC in 50 µl of pyrogen free-PBS or PBS alone (controls) were inoculated inside the cylinders, using a 22 g needle. After 15 days the liquid content of the cylinders was aspirated and the levels of the cytokines TNF-α, IL-12p70, IL-12p40 and IL-10 were determined by ELISA (D). Cylinders were removed, washed with saline and placed in cold PBS (4°C) for 30 min. Adherent cells (>90% macrophages) were removed from the interior of each cylinder to obtain a single cell suspension. The number of the macrophages recruited in each cylinder was measured (A), and their expression of Iab and CD86 was analyzed by flow cytometry (B-C). Results represent the arithmetic mean ± SEM (n = 12 for each experimental group). *, p<0.05 for Controls (CT) vs MSC.

Similar articles

Cited by

References

    1. Pittenger MF, Mackay AM, Beck SC, Jaiswal RK, Douglas R, et al. Multilineage potential of adult human mesenchymal stem cells. Science. 1999;284:143–147. - PubMed
    1. Keating A. Mesenchymal stromal cells. Curr Opin Hematol. 2006;13:419–425. - PMC - PubMed
    1. Chamberlain G, Fox J, Ashton B, Middleton J. Mesenchymal stem cells: their phenotype, differentiation capacity, immunological features, and potential for homing. Stem Cells. 2007;25:2739–2749. - PubMed
    1. Nauta AJ, Fibbe WE. Immunomodulatory properties of mesenchymal stromal cells. Blood. 2007;110:3499–3506. - PubMed
    1. Uccelli A, Moretta L, Pistoia V. Mesenchymal stem cells in health and disease. Nat Rev Immunol. 2008;8:726–736. - PubMed

Publication types

MeSH terms