. 2009:2009:121458.
doi: 10.1155/2009/121458. Epub 2010 Feb 11.

Biochanin A Modulates Cell Viability, Invasion, and Growth Promoting Signaling Pathways in HER-2-Positive Breast Cancer Cells

Affiliations

Biochanin A Modulates Cell Viability, Invasion, and Growth Promoting Signaling Pathways in HER-2-Positive Breast Cancer Cells

Vikas Sehdev et al. J Oncol. 2009.

Abstract

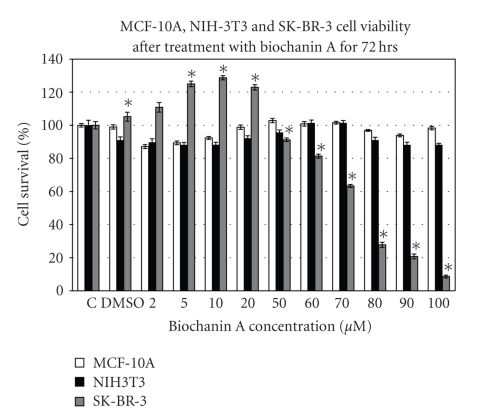
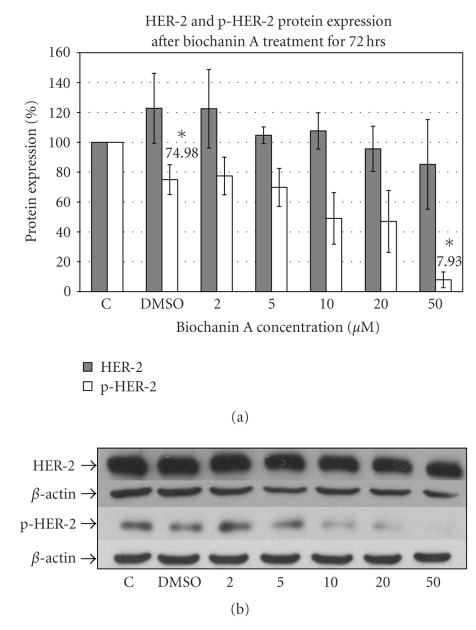
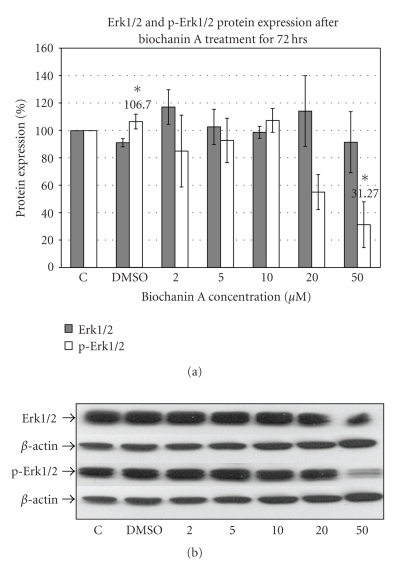
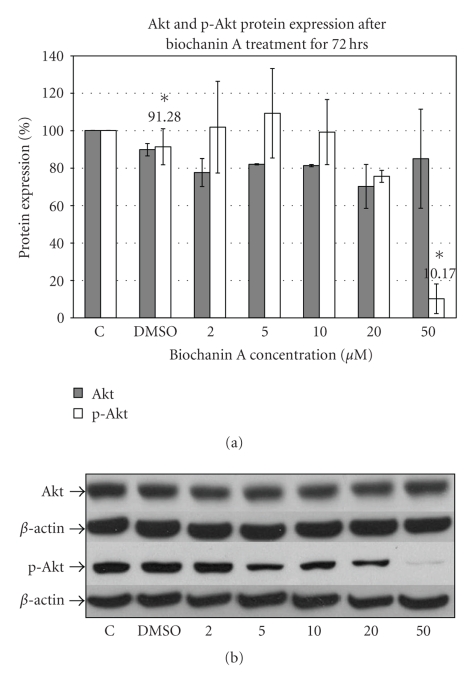
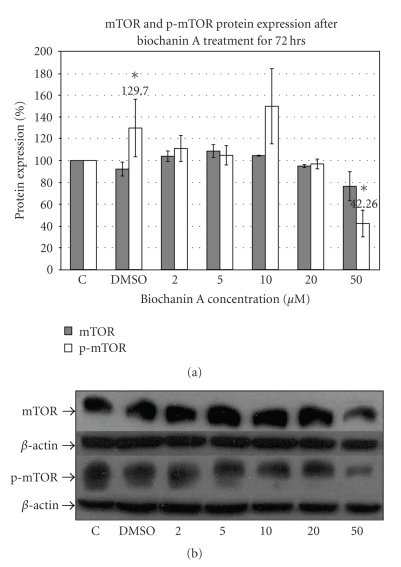
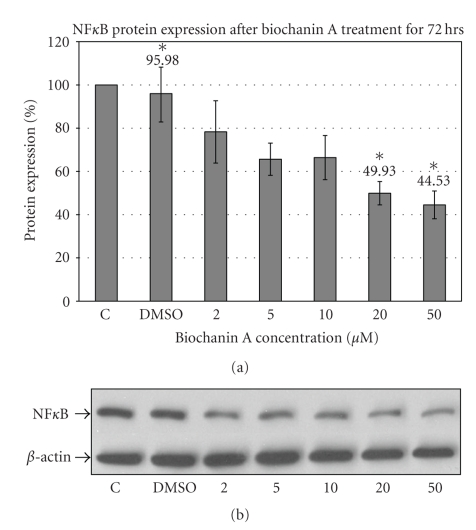
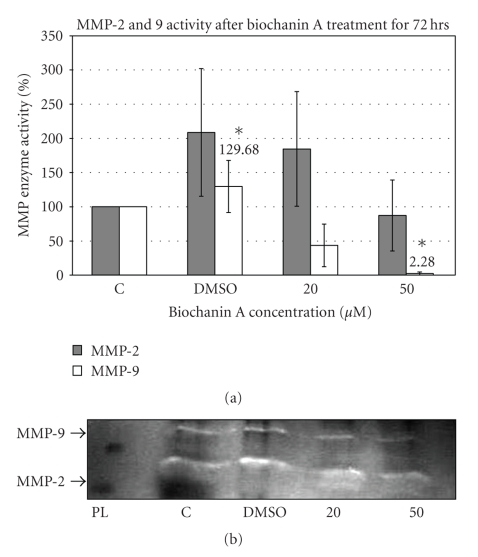
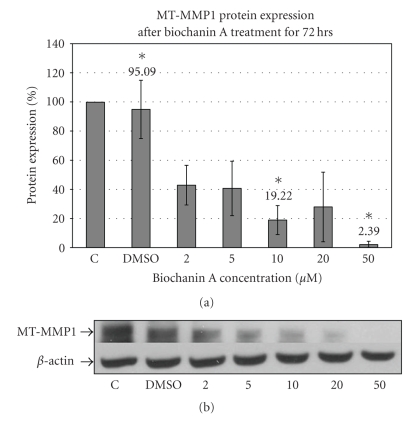
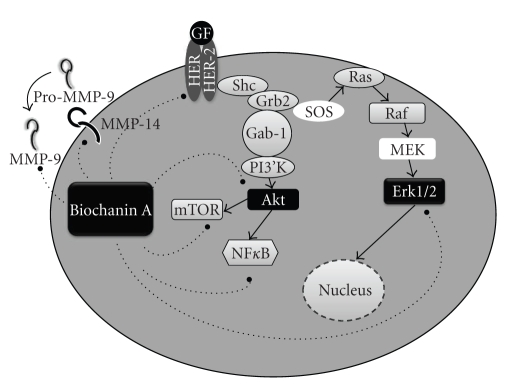
Overexpression of HER-2 receptor is associated with poor prognosis and aggressive forms of breast cancer. Scientific literature indicates a preventive role of isoflavones in cancer. Since activation of HER-2 receptor initiates growth-promoting events in cancer cells, we studied the effect of biochanin A (an isoflavone) on associated signaling events like receptor activation, downstream signaling, and invasive pathways. HER-2-positive SK-BR-3 breast cancer cells, MCF-10A normal breast epithelial cells, and NIH-3T3 normal fibroblast cells were treated with biochanin A (2-100 muM) for 72 hours. Subsequently cell viability assay, western blotting and zymography were carried out. The data indicate that biochanin A inhibits cell viability, signaling pathways, and invasive enzyme expression and activity in SK-BR-3 cancer cells. Biochanin A did not inhibit MCF-10A and NIH-3T3 cell viability. Therefore, biochanin A could be a unique natural anticancer agent which can selectively target cancer cells and inhibit multiple signaling pathways in HER-2-positive breast cancer cells.


Figures

Figure 1
Figure 1
Effect of biochanin A on MCF-10A, NIH-3T3, and SK-BR-3 cell viability. SK-BR-3/NIH-3T3 and MCF-10A cells were seeded at 2000 and 5000 cells/well in a 96-well plate. After 8 hours of cell adhesion period, the cells were treated with biochanin A (2–100 μM) for 72 hours. The data indicate a biphasic effect of biochanin A on SK-BR-3 breast cancer cell viability. Biochanin A did not inhibit MCF-10A and NIH-3T3 cell viability. C: control or no treatment; DMSO: vehicle (Statistical analysis: One-way Anova, n = 3, *P < .05).
Figure 2
Figure 2
Effect of biochanin A on HER-2 and p-HER-2 protein expression. (a) SK-BR-3 breast cancer cells were seeded in a T-75 flask in RPMI-1640 cell culture media (10% FBS). Following 72 hours of treatment with biochanin A (2–50 μM) HER-2 and p-HER-2 protein expression was evaluated. The data indicate reduced HER-2 phosphorylation with 50 μM biochanin A (7.93 ± 5.27; P < .05). C: control or no treatment; DMSO: vehicle (Statistical analysis: One-way Anova, n = 3, *P < .05). (b) Representative blot for HER-2 and p-HER-2 protein expression.
Figure 3
Figure 3
Effect of biochanin A on Erk1/2 and p-Erk1/2 protein expression. (a) SK-BR-3 breast cancer cells were seeded in a T-75 flask in RPMI-1640 cell culture media (10% FBS). Following 72 hours of treatment with biochanin A (2–50 μM) Erk1/2 and p-Erk1/2 protein expression was evaluated. The data indicate reduced Erk1/2 phosphorylation at 50 μM biochanin A (31.27 ± 16.71; P < .05). C: control or no treatment; DMSO: vehicle (Statistical analysis: One-way Anova, n = 3, *P < .05). (b) Representative blot for Erk1/2 and p-Erk1/2 protein expression.
Figure 4
Figure 4
Effect of biochanin A on Akt and p-Akt protein expression. (a) SK-BR-3 breast cancer cells were seeded in a T-75 flask in RPMI-1640 cell culture media (10% FBS). Following 72 hours of treatment with biochanin A (2–50 μM) Akt and p-Akt protein expression was evaluated. The data indicate reduced Akt phosphorylation at 50 μM (10.17 ± 7.89; P < .05) biochanin A. C: control or no treatment; DMSO: vehicle (Statistical analysis: One-way Anova, n = 3, *P < .05). (b) Representative blot for Akt and p-Akt protein expression.
Figure 5
Figure 5
Effect of biochanin A on mTOR and p-mTOR protein expression. (a) SK-BR-3 breast cancer cells were seeded in a T-75 flask in RPMI-1640 cell culture media (10% FBS). Following 72 hours of treatment with biochanin A (2–50 μM) mTOR and p-mTOR protein expression was evaluated. The data indicate reduced mTOR phosphorylation at 50 μM biochanin A (42.26 ± 12.18; P < .05). C: control or no treatment; DMSO: vehicle (Statistical analysis: One-way Anova, n = 3, *P < .05). (b) Representative blot for mTOR and p-mTOR protein expression.
Figure 6
Figure 6
Effect of biochanin A on NFκB protein expression. (a) SK-BR-3 breast cancer cells were seeded in a T-75 flask in RPMI-1640 cell culture media (10% FBS). Following 72 hours of treatment with biochanin A (2–50 μM) NFκB protein expression was evaluated. The data indicate reduced NFκB expression at 20 and 50 μM biochanin A (Biochanin A: 20 μM  → 49.93 ± 5.41; 50 μM  → 44.53 ± 6.44; P < .05). C: control or no treatment; DMSO: vehicle (Statistical analysis: One-way Anova, n = 3, *P < .05). (b) Representative blot for NFκB protein expression.
Figure 7
Figure 7
Effect of biochanin A on MMP-2 and MMP-9 activity. (a) SK-BR-3 breast cancer cells were seeded in a T-75 flask in RPMI-1640 cell culture media (10% FBS) for 24 hours. Subsequently they were treated for 72 hours with biochanin A (20 and 50 μM) in serum free conditions and MMP-2 and MMP-9 gelatinase enzyme activity was evaluated. The data indicate reduced MMP-9 activity with 50 μM biochanin A (2.28 ± 2.28; P < .05). C: control or no treatment; DMSO: vehicle; PL: protein ladder (Statistical analysis: One-way Anova, n = 3, *P < .05). (b) Representative gelatin gel for MMP-2 and MMP-9 activity.
Figure 8
Figure 8
Effect of biochanin A on MT-MMP1 protein expression. (a) SK-BR-3 breast cancer cells were seeded in a T-75 flask in RPMI-1640 cell culture media (10% FBS). Following 72 hours of treatment with biochanin A (2–50 μM) MT-MMP1 protein expression was evaluated. Our data indicate reduced MT-MMP-1 expression at 10 and 50 μM biochanin A (Biochanin A: 10 μM  → 19.22 ± 9.93; 50 μM  → 2.39 ± 2.30; P < .05). C: control or no treatment; DMSO: vehicle (Statistical analysis: One-way Anova, n = 3, *P < .05). (b) Representative blot for MT-MMP-1 protein expression.
Figure 9
Figure 9
Pathways inhibited by biochanin A in HER-2+ SK-BR-3 breast cancer cells. The protein expression data indicate that biochanin A treatment inhibits growth (p-HER-2, p-Erk), survival (Akt, mTOR, and NFκB), and invasion (MMP-9 and MMP-14) promoting pathways in SK-BR-3 cells.

References

    1. Cancer Facts and Figures. American Cancer Society, 2008.
    1. Hussain SA, Palmer DH, Spooner D, Rea DW. Molecularly targeted therapeutics for breast cancer. BioDrugs. 2007;21(4):215–224. - PubMed
    1. Harris L, Fritsche H, Mennel R, et al. American Society of Clinical Oncology 2007 update of recommendations for the use of tumor markers in breast cancer. Journal of Clinical Oncology. 2007;25(33):5287–5312. - PubMed
    1. Hanahan D, Weinberg RA. The hallmarks of cancer. Cell. 2000;100(1):57–70. - PubMed
    1. Polyak K. On the birth of breast cancer. Biochimica et Biophysica Acta. 2001;1552(1):1–13. - PubMed