

Tumour cell lines HT-29 and FaDu produce proinflammatory cytokines and activate neutrophils in vitro: possible applications for neutrophil-based antitumour treatment
- PMID: 20169105
- PMCID: PMC2821782
- DOI: 10.1155/2009/817498
Tumour cell lines HT-29 and FaDu produce proinflammatory cytokines and activate neutrophils in vitro: possible applications for neutrophil-based antitumour treatment
Abstract
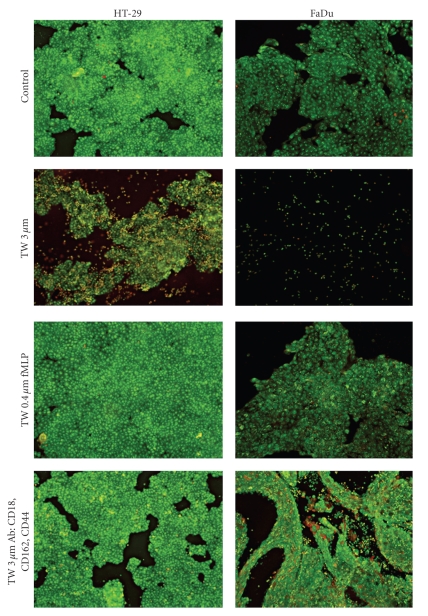
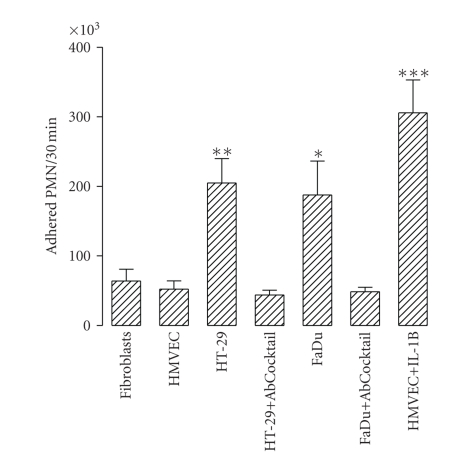
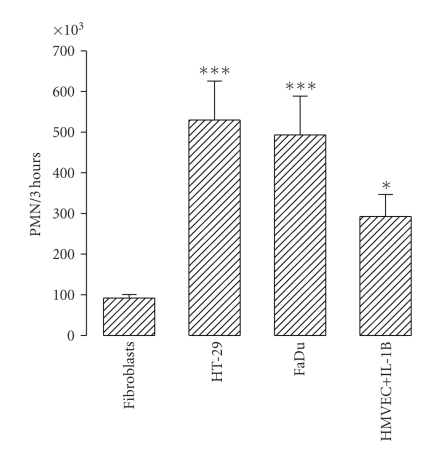
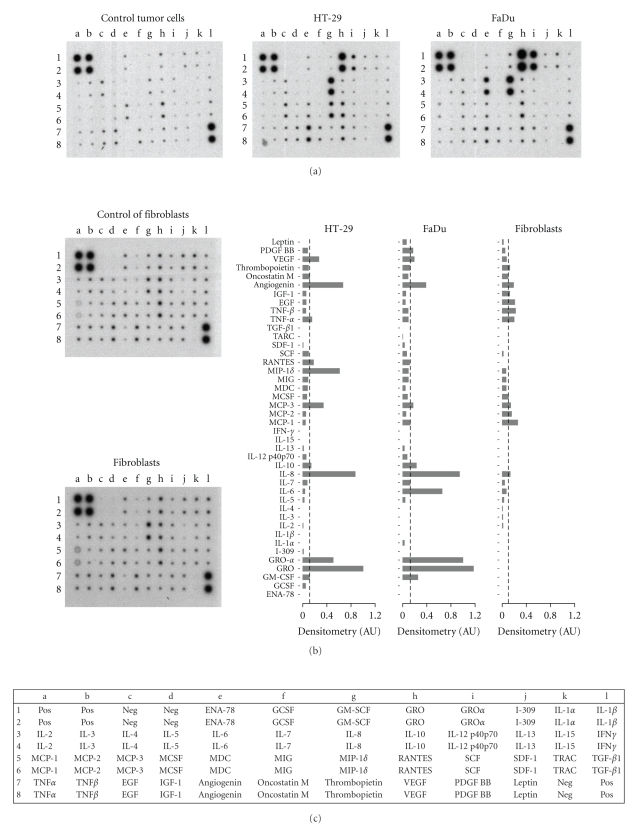
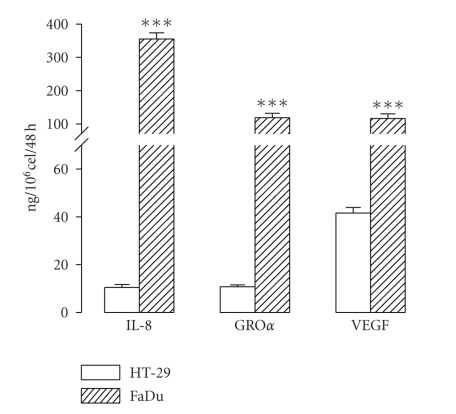
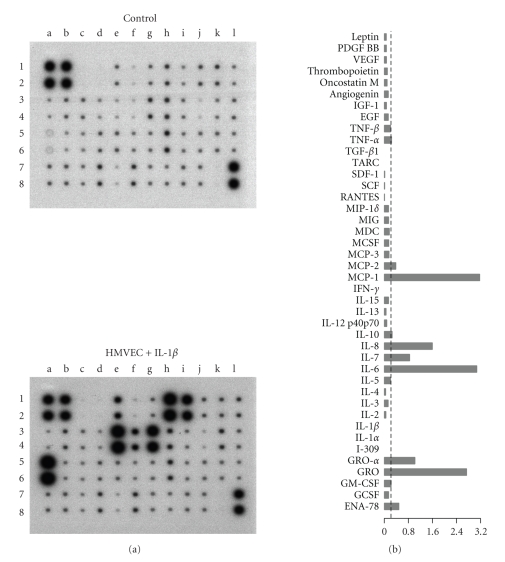
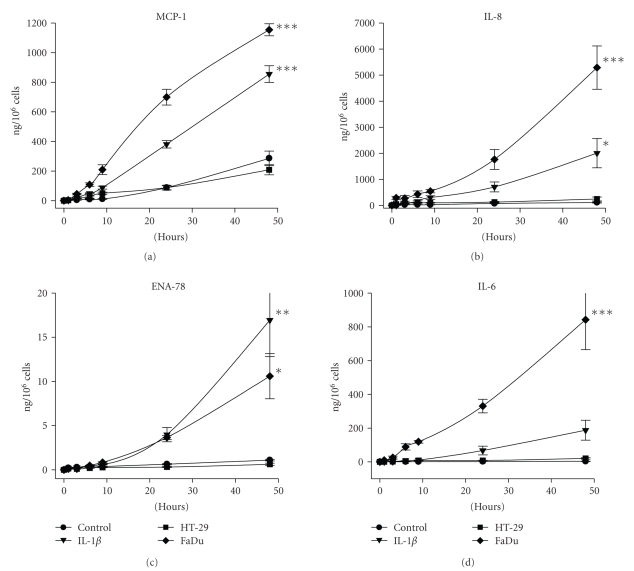
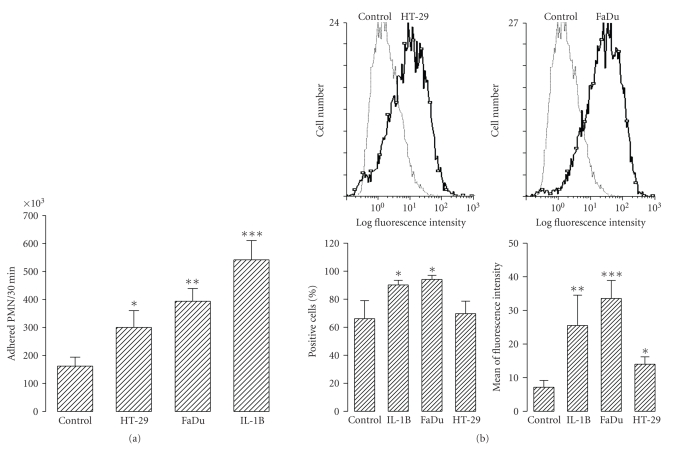
There is evidence that polymorphonuclear neutrophils (PMNs) can exert severe antineoplastic effects. Cross-talk between tumour cells and endothelial cells (ECs) is necessary for the accumulation of PMN around a tumour. This work reports the ability of two PMN-sensitive, human, permanent cell lines-colorectal adenocarcinoma (HT-29) and pharyngeal squamous-cell carcinoma (FaDu) cells-to act as inflammatory foci. PMNs were cytotoxic to both lines, the adhesion of the PMNs to the tumour cells being important in this effect. The tumour cells released appreciable amounts of IL-8 and GROalpha, and induced the transmigration of PMN through human microvascular-EC monolayers. Conditioning media associated with both lines induced the adhesion of PMN and the surface expression of ICAM-1 in microvascular-EC. In addition, FaDu-conditioning-medium strongly induced the production of proinflammatory cytokines by microvascular-EC. These results support the idea that tumour cells might normally induce a potent acute inflammatory response, leading to their own destruction.
Figures
Similar articles
-
Endothelial cell apicobasal polarity coordinates distinct responses to luminally versus abluminally delivered TNF-α in a microvascular mimetic.Integr Biol (Camb). 2020 Nov 18;12(11):275-289. doi: 10.1093/intbio/zyaa022. Integr Biol (Camb). 2020. PMID: 33164044 Free PMC article.
-
Effect of glutamine on cell adhesion molecule expression and leukocyte transmigration in endothelial cells stimulated by preeclamptic plasma.Nutrition. 2005 Nov-Dec;21(11-12):1134-40. doi: 10.1016/j.nut.2005.04.006. Nutrition. 2005. PMID: 16308137
-
Tumor-endothelium cross talk blocks recruitment of neutrophils to endothelial cells: a novel mechanism of endothelial cell anergy.Neoplasia. 2009 Oct;11(10):1054-63. doi: 10.1593/neo.09762. Neoplasia. 2009. PMID: 19794964 Free PMC article.
-
Mechanisms and regulation of polymorphonuclear leukocyte and eosinophil adherence to human airway epithelial cells.Am J Respir Cell Mol Biol. 1999 Sep;21(3):418-27. doi: 10.1165/ajrcmb.21.3.3478. Am J Respir Cell Mol Biol. 1999. PMID: 10460760
-
Cross-Talk among Polymorphonuclear Neutrophils, Immune, and Non-Immune Cells via Released Cytokines, Granule Proteins, Microvesicles, and Neutrophil Extracellular Trap Formation: A Novel Concept of Biology and Pathobiology for Neutrophils.Int J Mol Sci. 2021 Mar 18;22(6):3119. doi: 10.3390/ijms22063119. Int J Mol Sci. 2021. PMID: 33803773 Free PMC article. Review.
Cited by
-
Study of tumor growth indicates the existence of an "immunological threshold" separating states of pro- and antitumoral peritumoral inflammation.PLoS One. 2018 Nov 2;13(11):e0202823. doi: 10.1371/journal.pone.0202823. eCollection 2018. PLoS One. 2018. PMID: 30388111 Free PMC article.
-
The Clinical Significance and Role of CXCL1 Chemokine in Gastrointestinal Cancers.Cells. 2023 May 17;12(10):1406. doi: 10.3390/cells12101406. Cells. 2023. PMID: 37408240 Free PMC article. Review.
-
Acute bacterial infection negatively impacts cancer specific survival of colorectal cancer patients.World J Gastroenterol. 2014 Oct 14;20(38):13930-5. doi: 10.3748/wjg.v20.i38.13930. World J Gastroenterol. 2014. PMID: 25320529 Free PMC article.
-
Microvascular COX-2/mPGES-1/EP-4 axis in human abdominal aortic aneurysm.J Lipid Res. 2013 Dec;54(12):3506-15. doi: 10.1194/jlr.M042481. Epub 2013 Oct 16. J Lipid Res. 2013. PMID: 24133193 Free PMC article.
-
Expression and Cellular Localization of 15-Hydroxy-Prostaglandin-Dehydrogenase in Abdominal Aortic Aneurysm.PLoS One. 2015 Aug 19;10(8):e0136201. doi: 10.1371/journal.pone.0136201. eCollection 2015. PLoS One. 2015. PMID: 26287481 Free PMC article.
References
-
- Clark RA, Klebanoff SJ, Einstein AB, Fefer A. Peroxidase H2O2 halide system: cytotoxic effect on mammalian tumor cells. Blood. 1975;45(2):161–170. - PubMed
-
- Rinehart JJ, Lange P, Gormus BJ, Kaplan ME. Human monocyte-induced tumor cell cytotoxicity. Blood. 1978;52(1):211–220. - PubMed
-
- Slivka A, LoBuglio AF, Weiss SJ. A potential role for hypochlorous acid in granulocyte-mediated tumor cell cytotoxicity. Blood. 1980;55(2):347–350. - PubMed
Publication types
MeSH terms
Substances
LinkOut - more resources
Full Text Sources
Miscellaneous
