. 2010 Feb 15;5(2):e9210.
doi: 10.1371/journal.pone.0009210.

Quantitative kinetic study of the actin-bundling protein L-plastin and of its impact on actin turn-over

Affiliations

Quantitative kinetic study of the actin-bundling protein L-plastin and of its impact on actin turn-over

Ziad Al Tanoury et al. PLoS One. .

Abstract

Background: Initially detected in leukocytes and cancer cells derived from solid tissues, L-plastin/fimbrin belongs to a large family of actin crosslinkers and is considered as a marker for many cancers. Phosphorylation of L-plastin on residue Ser5 increases its F-actin binding activity and is required for L-plastin-mediated cell invasion.

Methodology/principal findings: To study the kinetics of L-plastin and the impact of L-plastin Ser5 phosphorylation on L-plastin dynamics and actin turn-over in live cells, simian Vero cells were transfected with GFP-coupled WT-L-plastin, Ser5 substitution variants (S5/A, S5/E) or actin and analyzed by fluorescence recovery after photobleaching (FRAP). FRAP data were explored by mathematical modeling to estimate steady-state reaction parameters. We demonstrate that in Vero cell focal adhesions L-plastin undergoes rapid cycles of association/dissociation following a two-binding-state model. Phosphorylation of L-plastin increased its association rates by two-fold, whereas dissociation rates were unaffected. Importantly, L-plastin affected actin turn-over by decreasing the actin dissociation rate by four-fold, increasing thereby the amount of F-actin in the focal adhesions, all these effects being promoted by Ser5 phosphorylation. In MCF-7 breast carcinoma cells, phorbol 12-myristate 13-acetate (PMA) treatment induced L-plastin translocation to de novo actin polymerization sites in ruffling membranes and spike-like structures and highly increased its Ser5 phosphorylation. Both inhibition studies and siRNA knock-down of PKC isozymes pointed to the involvement of the novel PKC-delta isozyme in the PMA-elicited signaling pathway leading to L-plastin Ser5 phosphorylation. Furthermore, the L-plastin contribution to actin dynamics regulation was substantiated by its association with a protein complex comprising cortactin, which is known to be involved in this process.

Conclusions/significance: Altogether these findings quantitatively demonstrate for the first time that L-plastin contributes to the fine-tuning of actin turn-over, an activity which is regulated by Ser5 phosphorylation promoting its high affinity binding to the cytoskeleton. In carcinoma cells, PKC-delta signaling pathways appear to link L-plastin phosphorylation to actin polymerization and invasion.


Conflict of interest statement

Competing Interests: The authors have declared that no competing interests exist.

Figures

Figure 1
Figure 1. L-plastin phosphorylation modulates its mobility in focal adhesions.
(A). Schematic representation of wild-type (WT) L-plastin showing the headpiece domain followed by two independent actin binding domains (ABDs). Residue serine-5 (Ser5) of the headpiece was mutated to alanine (SA) to generate unphosphorylatable L-plastin or to glutamic acid (SE) to generate an L-plastin variant mimicking constitutive phosphorylation. (B). Expression and localization of GFP-coupled L-plastin phosphorylation variants in Vero cells. Vero cells were transfected with cDNA encoding GFP-L-plastin phosphorylation variants. After 48 hours, cells were fixed and processed for immunofluorescence. The localization of L-plastin and F-actin was analyzed with an epifluorescence microscope (Leica DMRX microscope) after staining with Rhodamine-conjugated phalloidin to visualize polymerized actin. Scale bar, 20 µm. (C). A typical FRAP experiment carried out on a Vero cell transfected with WT GFP-L-plastin. The boxed region in the upper panel (scale bar, 10 µm) is shown enlarged in the bottom panels (scale bar, 4 µm). Circular spots, surrounded by a white line, are regions of interest (ROI) that are submitted to photobleaching and that have a diameter of 5 µm. Such spot size was selected to smooth local area effects and visually well-represents the focal adhesion region. Pictures were recorded before bleaching, immediately after bleaching and 90 seconds after bleaching. (D). Normalized FRAP recovery curves of wild type (WT, red), Ser5/Ala (SA, blue) and Ser5/Glu (SE, green) GFP-L-plastin fusions are compared to the curves predicted by the two-binding-state model (black curves). Data were obtained from three independent experiments representing 10 FRAP recordings for each condition. (E). Charts representing biochemical parameters obtained from fitting data with a two-binding-state model. Bars represent the mean ± s.d. P-values were calculated using standard Student's t-test. A p-value<0.05, considered as statistically significant, was obtained for Feq, k*1on and k*2on but not for k1off.
Figure 2
Figure 2. L-plastin phosphorylation modulates actin dynamics in focal adhesions.
(A). Expression of L-plastin and actin in live Vero cells. Vero cells were cotransfected with monomeric L-plastin-DsRed-N1 fusion variants and GFP-actin. Wild type L-plastin-DsRed is shown here. Scale bar, 20 µm. (B). Normalized FRAP recovery curves obtained for actin in presence of wild type (WT, red), Ser5/Ala (SA, blue) and Ser5/Glu (SE, green) L-plastin-DsRed fusions or DsRed alone (control, orange) are compared to the curves predicted by the one-binding-state model (black curves). Data were obtained from three independent experiments representing 10 FRAP recordings for each condition. (C). Charts representing biochemical parameters obtained from data fitted with a one-binding-state model. Bars represent the mean ± s.d.
Figure 3
Figure 3. PMA induces the translocation of L-plastin to de novo assembled actin structures and triggers L-plastin phosphorylation.
(A). PMA induces actin reorganization with concurrent local accumulation of L-plastin in actin-rich structures. MCF-7 cells were pretreated with or without 0.5 µM cytochalasin D (CytoD) and then treated with 1 µM PMA as indicated. The localization of L-plastin and F-actin was analyzed by epifluorescence microscopy after staining with an anti-L-plastin antibody and Alexa 488-conjugated phalloidin. The merged image of the boxed region indicated in the fourth row middle panel is shown enlarged on the right; scale bar, 2.5 µm. Other scale bars, 10 µm. (B). PMA induces phosphorylation of L-plastin on residue Ser5. MCF-7 cells were treated for 1 hour with or without 1 µM PMA at 37°C. Total cell extracts (50 µg) were analyzed by immunoblotting using antibodies specific for Ser5 phosphorylated L-plastin (anti-Ser5-P, upper panel), L-plastin (middle panel) or GAPDH (lower panel) to monitor equal protein loading. (C). Intracellular localization of Ser5 phosphorylated L-plastin in PMA-treated MCF-7 cells. MCF-7 cells treated for 1 h with 1 µM PMA were analyzed by epifluorescence microscopy after staining with an anti-Ser5-P antibody and Rhodamine-conjugated phalloidin. Upper panels illustrate the colocalization of Ser5 phosphorylated L-plastin with F-actin in ruffling membranes. Middle panels represent an enlarged detail of the cell shown in the upper panels (squared area). Lower panels represent a magnified detail of another cell showing the colocalization of Ser5 phosphorylated L-plastin with F-actin in spike-like structures. Scale bars, 10 µm (upper panels) and 2.5 µm (middle and lower panels).
Figure 4
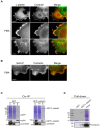
Figure 4. L-plastin associates with cortactin in protein complexes.
(A). Colocalization of L-plastin with cortactin in MCF-7 cells. MCF-7 cells were treated with 1 µM PMA as described and analyzed by epifluorescence microscopy after staining with antibodies specific for L-plastin and cortactin. Immunofluorescence images illustrate the colocalization of L-plastin (red) and cortactin (green) in ruffling membranes (upper and middle panels) and at a lower extent in the membrane-embedded portion of spikes (lower panel). Arrows point to regions of colocalization. Scale bars, 10 µm (upper panels) and 3 µm (middle and lower panels). (B). Colocalization of serine-5 phosphorylated L-plastin with cortactin in MCF-7 cells. PMA-treated MCF-7 cells were stained with anti-Ser5-P and anti-cortactin antibodies and analyzed by epifluorescence microscopy. Serine-5 phosphorylated L-plastin (green) and cortactin (red) are colocalized in ruffling membranes. Scale bar, 3 µm. (C). Coimmunoprecipitation of cortactin with GFP-L-plastin in MCF-7 cells. GFP- or GFP-L-plastin-expressing MCF-7 cells were treated with PMA as described. Following cell lysis, protein extracts were subjected to immunoprecipitation with GFP-nanotrap. Aliquots of input [In], flow-through [FT], and bound fraction [B] were separated by SDS-PAGE and visualized either by Coomassie Blue staining (upper panels) or by immunoblot analysis using antibodies specific for GFP (middle panels) or cortactin (bottom panels). (D). Pull-down assay with cell extracts. GST and GST-L-plastin (20 µg) immobilized on glutathione-sepharose beads were incubated with untreated MCF-7 cell extracts (200 µg). The resulting complex was precipitated by centrifugation, separated by SDS-PAGE and visualized by Coomassie Blue staining (upper panel) or by immunoblotting using a cortactin-specific antibody (lower panel).
Figure 5
Figure 5. The novel PKC-δ isozyme is necessary for PMA-induced cytoskeleton reorganization and L-plastin Ser5 phosphorylation.
(A). Novel PKC isozymes regulate PMA-induced L-plastin phosphorylation in MCF-7 cells. MCF-7 cells were pretreated for 3 hours with 5 µM of GF109203X (specific for α, β1, δ, ε, and ζ) or 0.5 µM of Gö6976 (specific for α and β1) and then treated for 1 hour with or without 1 µM PMA at 37°C. Total cell extracts (50 µg) were analyzed by immunoblotting using anti-Ser5-P L-plastin (upper panel) or anti-GAPDH (lower panel) antibodies. (B). PMA-induced actin cytoskeleton remodeling and L-plastin translocation involves novel PKC isozymes. MCF-7 cells were pretreated for 3 hours with 5 µM GF109203X or 0.5 µM Gö6976, then treated for 1 hour with 1 µM PMA at 37°C. Cells were then fixed and processed for immunofluorescence. Labeled cells were analyzed with an epifluorescence microscope after staining with an anti-L-plastin antibody and Alexa 488-conjugated phalloidin. Scale bar, 10 µm. (C). SiRNA knock-down of PKC-δ decreased PMA-induced L-plastin phosphorylation in MCF-7. MCF-7 cells were transfected with either PKC-δ or PKC-ε siRNAs as well as with negative control siRNA (Ctrl) for 48 hours and then treated with PMA as indicated. Total cell extracts (50 µg) were analyzed by immunoblotting using antibodies specific for Ser5 phosphorylated L-plastin, PKC-ε, PKC-δ and total L-plastin. GAPDH was used to monitor equal protein loading.

Similar articles

Cited by

References

    1. Fidler IJ. Critical determinants of cancer metastasis: rationale for therapy. Cancer Chemother Pharmacol. 1999;43(Suppl):S3–10. - PubMed
    1. Matsushima K, Shiroo M, Kung HF, Copeland TD. Purification and characterization of a cytosolic 65-kilodalton phosphoprotein in human leukocytes whose phosphorylation is augmented by stimulation with interleukin 1. Biochemistry. 1988;27:3765–3770. - PubMed
    1. Lapillonne A, Coue O, Friederich E, Nicolas A, Del Maestro L, et al. Expression patterns of L-plastin isoform in normal and carcinomatous breast tissues. Anticancer Res. 2000;20:3177–3182. - PubMed
    1. Park T, Chen ZP, Leavitt J. Activation of the leukocyte plastin gene occurs in most human cancer cells. Cancer Res. 1994;54:1775–1781. - PubMed
    1. Lin CS, Park T, Chen ZP, Leavitt J. Human plastin genes. Comparative gene structure, chromosome location, and differential expression in normal and neoplastic cells. J Biol Chem. 1993;268:2781–2792. - PubMed

Publication types

MeSH terms