Delineating genetic alterations for tumor progression in the MCF10A series of breast cancer cell lines
- PMID: 20169162
- PMCID: PMC2821407
- DOI: 10.1371/journal.pone.0009201
Delineating genetic alterations for tumor progression in the MCF10A series of breast cancer cell lines
Abstract
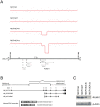
To gain insight into the role of genomic alterations in breast cancer progression, we conducted a comprehensive genetic characterization of a series of four cell lines derived from MCF10A. MCF10A is an immortalized mammary epithelial cell line (MEC); MCF10AT is a premalignant cell line generated from MCF10A by transformation with an activated HRAS gene; MCF10CA1h and MCF10CA1a, both derived from MCF10AT xenografts, form well-differentiated and poorly-differentiated malignant tumors in the xenograft models, respectively. We analyzed DNA copy number variation using the Affymetrix 500 K SNP arrays with the goal of identifying gene-specific amplification and deletion events. In addition to a previously noted deletion in the CDKN2A locus, our studies identified MYC amplification in all four cell lines. Additionally, we found intragenic deletions in several genes, including LRP1B in MCF10CA1h and MCF10CA1a, FHIT and CDH13 in MCF10CA1h, and RUNX1 in MCF10CA1a. We confirmed the deletion of RUNX1 in MCF10CA1a by DNA and RNA analyses, as well as the absence of the RUNX1 protein in that cell line. Furthermore, we found that RUNX1 expression was reduced in high-grade primary breast tumors compared to low/mid-grade tumors. Mutational analysis identified an activating PIK3CA mutation, H1047R, in MCF10CA1h and MCF10CA1a, which correlates with an increase of AKT1 phosphorylation at Ser473 and Thr308. Furthermore, we showed increased expression levels for genes located in the genomic regions with copy number gain. Thus, our genetic analyses have uncovered sequential molecular events that delineate breast tumor progression. These events include CDKN2A deletion and MYC amplification in immortalization, HRAS activation in transformation, PIK3CA activation in the formation of malignant tumors, and RUNX1 deletion associated with poorly-differentiated malignant tumors.
Conflict of interest statement
Figures


Similar articles
-
Identification of novel gene amplifications in breast cancer and coexistence of gene amplification with an activating mutation of PIK3CA.Cancer Res. 2009 Sep 15;69(18):7357-65. doi: 10.1158/0008-5472.CAN-09-0064. Epub 2009 Aug 25. Cancer Res. 2009. PMID: 19706770 Free PMC article.
-
Using the MCF10A/MCF10CA1a Breast Cancer Progression Cell Line Model to Investigate the Effect of Active, Mutant Forms of EGFR in Breast Cancer Development and Treatment Using Gefitinib.PLoS One. 2015 May 13;10(5):e0125232. doi: 10.1371/journal.pone.0125232. eCollection 2015. PLoS One. 2015. PMID: 25969993 Free PMC article.
-
High-resolution array copy number analyses for detection of deletion, gain, amplification and copy-neutral LOH in primary neuroblastoma tumors: four cases of homozygous deletions of the CDKN2A gene.BMC Genomics. 2008 Jul 29;9:353. doi: 10.1186/1471-2164-9-353. BMC Genomics. 2008. PMID: 18664255 Free PMC article.
-
Gene methylation in gastric cancer.Clin Chim Acta. 2013 Sep 23;424:53-65. doi: 10.1016/j.cca.2013.05.002. Epub 2013 May 10. Clin Chim Acta. 2013. PMID: 23669186 Review.
-
RUNX1 as a Novel Molecular Target for Breast Cancer.Clin Breast Cancer. 2022 Aug;22(6):499-506. doi: 10.1016/j.clbc.2022.04.006. Epub 2022 Apr 26. Clin Breast Cancer. 2022. PMID: 35599145 Review.
Cited by
-
IGF2BP2 promotes cancer progression by degrading the RNA transcript encoding a v-ATPase subunit.Proc Natl Acad Sci U S A. 2022 Nov 8;119(45):e2200477119. doi: 10.1073/pnas.2200477119. Epub 2022 Nov 2. Proc Natl Acad Sci U S A. 2022. PMID: 36322753 Free PMC article.
-
Intermittent hypoxia selects for genotypes and phenotypes that increase survival, invasion, and therapy resistance.PLoS One. 2015 Mar 26;10(3):e0120958. doi: 10.1371/journal.pone.0120958. eCollection 2015. PLoS One. 2015. PMID: 25811878 Free PMC article.
-
Size matters: sequential mutations in tumorigenesis may reflect the stochastic effect of mutagen target sizes.Genes Cancer. 2011 Oct;2(10):927-31. doi: 10.1177/1947601911436200. Genes Cancer. 2011. PMID: 22701759 Free PMC article.
-
Cellular Senescence in Normal Mammary Gland and Breast Cancer. Implications for Cancer Therapy.Genes (Basel). 2022 Jun 1;13(6):994. doi: 10.3390/genes13060994. Genes (Basel). 2022. PMID: 35741756 Free PMC article. Review.
-
An Early Neoplasia Index (ENI10), Based on Molecular Identity of CD10 Cells and Associated Stemness Biomarkers, is a Predictor of Patient Outcome in Many Cancers.Cancer Res Commun. 2023 Sep 29;3(9):1966-1980. doi: 10.1158/2767-9764.CRC-23-0196. Cancer Res Commun. 2023. PMID: 37707389 Free PMC article.
References
-
- Soule HD, Maloney TM, Wolman SR, Peterson WD, Jr, Brenz R, et al. Isolation and characterization of a spontaneously immortalized human breast epithelial cell line, MCF-10. Cancer Res. 1990;50:6075–6086. - PubMed
-
- Santner SJ, Dawson PJ, Tait L, Soule HD, Eliason J, et al. Malignant MCF10CA1 cell lines derived from premalignant human breast epithelial MCF10AT cells. Breast Cancer Res Treat. 2001;65:101–110. - PubMed
-
- Kim IY, Yong HY, Kang KW, Moon A. Overexpression of ErbB2 induces invasion of MCF10A human breast epithelial cells via MMP-9. Cancer Lett. 2009;275:227–233. - PubMed
-
- Arima Y, Inoue Y, Shibata T, Hayashi H, Nagano O, et al. Rb depletion results in deregulation of E-cadherin and induction of cellular phenotypic changes that are characteristic of the epithelial-to-mesenchymal transition. Cancer Res. 2008;68:5104–5112. - PubMed
Publication types
MeSH terms
Substances
Associated data
- Actions
Grants and funding
LinkOut - more resources
Full Text Sources
Other Literature Sources
Medical
Molecular Biology Databases
Research Materials
Miscellaneous

