

In vitro fertilization and embryo culture strongly impact the placental transcriptome in the mouse model
- PMID: 20169163
- PMCID: PMC2821408
- DOI: 10.1371/journal.pone.0009218
In vitro fertilization and embryo culture strongly impact the placental transcriptome in the mouse model
Abstract
Background: Assisted Reproductive Technologies (ART) are increasingly used in humans; however, their impact is now questioned. At blastocyst stage, the trophectoderm is directly in contact with an artificial medium environment, which can impact placental development. This study was designed to carry out an in-depth analysis of the placental transcriptome after ART in mice.
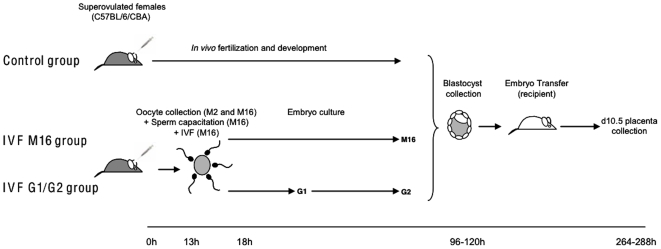
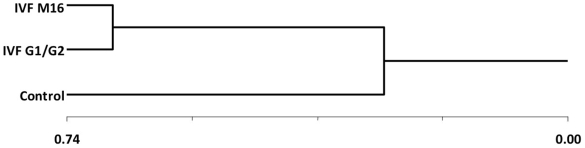
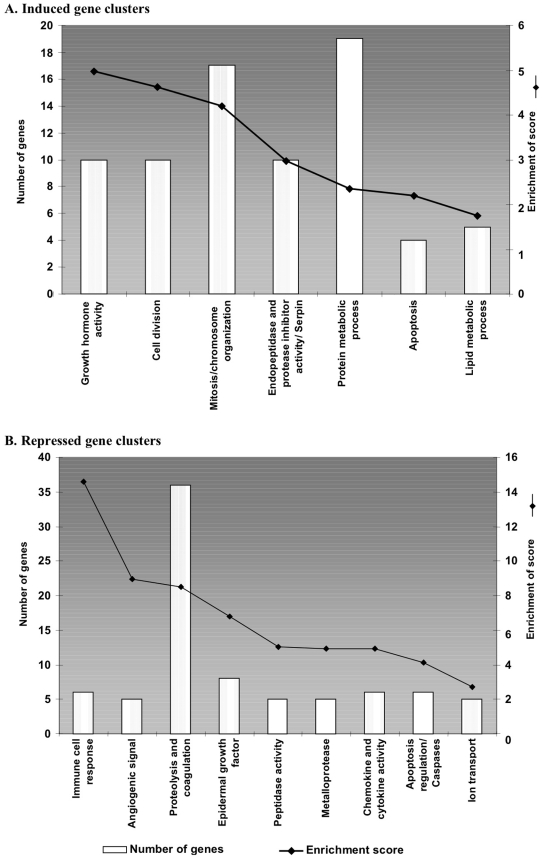
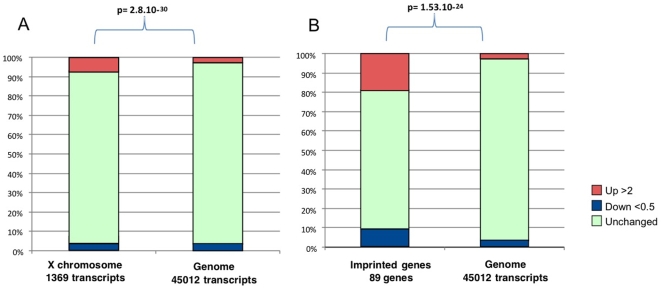
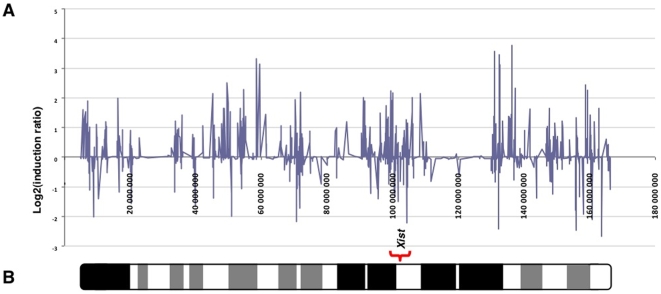
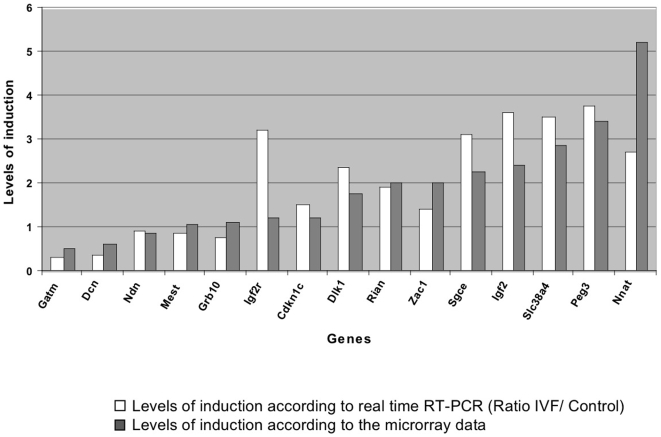
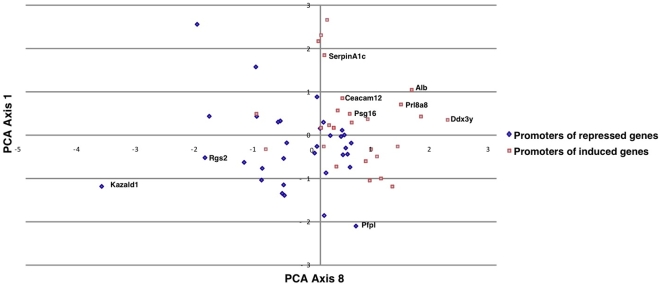
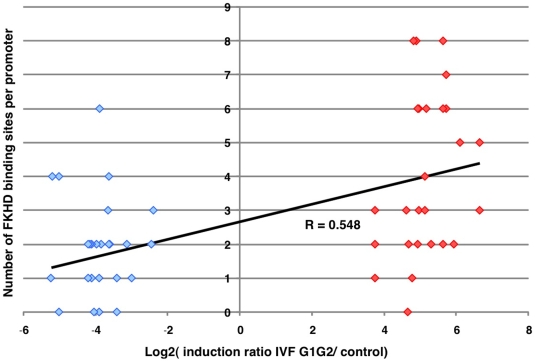
Methodology/principal findings: Blastocysts were transferred either (1) after in vivo fertilization and development (control group) or (2) after in vitro fertilization and embryo culture. Placentas were then analyzed at E10.5. Six percent of transcripts were altered at the two-fold threshold in placentas of manipulated embryos, 2/3 of transcripts being down-regulated. Strikingly, the X-chromosome harbors 11% of altered genes, 2/3 being induced. Imprinted genes were modified similarly to the X. Promoter composition analysis indicates that FOXA transcription factors may be involved in the transcriptional deregulations.
Conclusions: For the first time, our study shows that in vitro fertilization associated with embryo culture strongly modify the placental expression profile, long after embryo manipulations, meaning that the stress of artificial environment is memorized after implantation. Expression of X and imprinted genes is also greatly modulated probably to adapt to adverse conditions. Our results highlight the importance of studying human placentas from ART.
Conflict of interest statement
Figures

Similar articles
-
ART culture conditions change the probability of mouse embryo gestation through defined cellular and molecular responses.Hum Reprod. 2012 Sep;27(9):2627-40. doi: 10.1093/humrep/des223. Epub 2012 Jun 26. Hum Reprod. 2012. PMID: 22736328
-
Dynamic integrated analysis of DNA methylation and gene expression profiles in in vivo and in vitro fertilized mouse post-implantation extraembryonic and placental tissues.Mol Hum Reprod. 2016 Jul;22(7):485-98. doi: 10.1093/molehr/gaw028. Epub 2016 Apr 18. Mol Hum Reprod. 2016. PMID: 27090932
-
Differences in gene expression profiles between human preimplantation embryos cultured in two different IVF culture media.Hum Reprod. 2015 Oct;30(10):2303-11. doi: 10.1093/humrep/dev179. Epub 2015 Jul 22. Hum Reprod. 2015. PMID: 26202924 Clinical Trial.
-
Long term effects of ART: What do animals tell us?Mol Reprod Dev. 2018 Apr;85(4):348-368. doi: 10.1002/mrd.22970. Epub 2018 Mar 23. Mol Reprod Dev. 2018. PMID: 29457303 Review.
-
The influence of in vitro fertilization and embryo culture on the embryo epigenetic constituents and the possible consequences in the bovine model.J Dev Orig Health Dis. 2017 Aug;8(4):411-417. doi: 10.1017/S2040174417000125. Epub 2017 Mar 6. J Dev Orig Health Dis. 2017. PMID: 28260557 Review.
Cited by
-
Assisted reproduction treatment and epigenetic inheritance.Hum Reprod Update. 2012 Mar-Apr;18(2):171-97. doi: 10.1093/humupd/dmr047. Epub 2012 Jan 19. Hum Reprod Update. 2012. PMID: 22267841 Free PMC article. Review.
-
The placenta: phenotypic and epigenetic modifications induced by Assisted Reproductive Technologies throughout pregnancy.Clin Epigenetics. 2015 Aug 21;7(1):87. doi: 10.1186/s13148-015-0120-2. eCollection 2015. Clin Epigenetics. 2015. PMID: 26300992 Free PMC article. Review.
-
Morphologic and molecular changes in the placenta: what we can learn from environmental exposures.Fertil Steril. 2016 Sep 15;106(4):930-40. doi: 10.1016/j.fertnstert.2016.08.016. Epub 2016 Aug 11. Fertil Steril. 2016. PMID: 27523298 Free PMC article. Review.
-
Cryopreserved embryo replacement is associated with higher birthweight compared with fresh embryo: multicentric sibling embryo cohort study.Sci Rep. 2019 Sep 16;9(1):13402. doi: 10.1038/s41598-019-49708-7. Sci Rep. 2019. PMID: 31527739 Free PMC article.
-
Expert consensus document: Clinical and molecular diagnosis, screening and management of Beckwith-Wiedemann syndrome: an international consensus statement.Nat Rev Endocrinol. 2018 Apr;14(4):229-249. doi: 10.1038/nrendo.2017.166. Epub 2018 Jan 29. Nat Rev Endocrinol. 2018. PMID: 29377879 Free PMC article. Review.
References
-
- Wright VC, Chang J, Jeng G, Macaluso M. Assisted reproductive technology surveillance–United States, 2005. MMWR Surveill Summ. 2008;57:1–23. - PubMed
-
- El-Chaar D, Yang Q, Gao J, Bottomley J, Leader A, et al. Risk of birth defects increased in pregnancies conceived by assisted human reproduction. Fertil Steril. 2009;92:1557–1561. - PubMed
-
- Hansen M, Bower C, Milne E, de Klerk N, Kurinczuk JJ. Assisted reproductive technologies and the risk of birth defects–a systematic review. Hum Reprod. 2005;20:328–338. - PubMed
-
- Stromberg B, Dahlquist G, Ericson A, Finnstrom O, Koster M, et al. Neurological sequelae in children born after in-vitro fertilisation: a population-based study. Lancet. 2002;359:461–465. - PubMed
-
- Olson CK, Keppler-Noreuil KM, Romitti PA, Budelier WT, Ryan G, et al. In vitro fertilization is associated with an increase in major birth defects. Fertil Steril. 2005;84:1308–1315. - PubMed
Publication types
MeSH terms
LinkOut - more resources
Full Text Sources
Other Literature Sources
