

A kinetic model of dopamine- and calcium-dependent striatal synaptic plasticity
- PMID: 20169176
- PMCID: PMC2820521
- DOI: 10.1371/journal.pcbi.1000670
A kinetic model of dopamine- and calcium-dependent striatal synaptic plasticity
Abstract
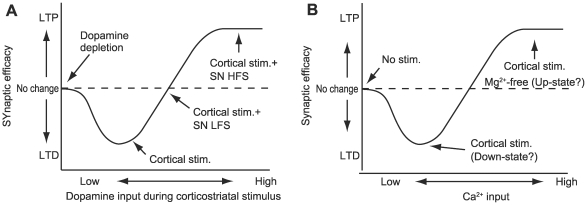
Corticostriatal synapse plasticity of medium spiny neurons is regulated by glutamate input from the cortex and dopamine input from the substantia nigra. While cortical stimulation alone results in long-term depression (LTD), the combination with dopamine switches LTD to long-term potentiation (LTP), which is known as dopamine-dependent plasticity. LTP is also induced by cortical stimulation in magnesium-free solution, which leads to massive calcium influx through NMDA-type receptors and is regarded as calcium-dependent plasticity. Signaling cascades in the corticostriatal spines are currently under investigation. However, because of the existence of multiple excitatory and inhibitory pathways with loops, the mechanisms regulating the two types of plasticity remain poorly understood. A signaling pathway model of spines that express D1-type dopamine receptors was constructed to analyze the dynamic mechanisms of dopamine- and calcium-dependent plasticity. The model incorporated all major signaling molecules, including dopamine- and cyclic AMP-regulated phosphoprotein with a molecular weight of 32 kDa (DARPP32), as well as AMPA receptor trafficking in the post-synaptic membrane. Simulations with dopamine and calcium inputs reproduced dopamine- and calcium-dependent plasticity. Further in silico experiments revealed that the positive feedback loop consisted of protein kinase A (PKA), protein phosphatase 2A (PP2A), and the phosphorylation site at threonine 75 of DARPP-32 (Thr75) served as the major switch for inducing LTD and LTP. Calcium input modulated this loop through the PP2B (phosphatase 2B)-CK1 (casein kinase 1)-Cdk5 (cyclin-dependent kinase 5)-Thr75 pathway and PP2A, whereas calcium and dopamine input activated the loop via PKA activation by cyclic AMP (cAMP). The positive feedback loop displayed robust bi-stable responses following changes in the reaction parameters. Increased basal dopamine levels disrupted this dopamine-dependent plasticity. The present model elucidated the mechanisms involved in bidirectional regulation of corticostriatal synapses and will allow for further exploration into causes and therapies for dysfunctions such as drug addiction.
Conflict of interest statement
The authors have declared that no competing interests exist.
Figures
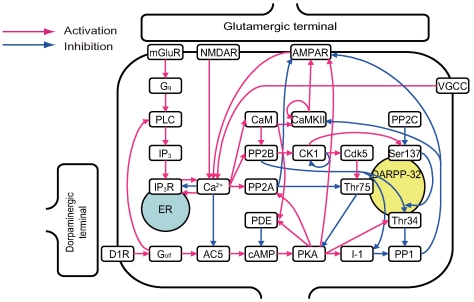
 receptor should be mentioned. The activation level (open probability) of
  receptor displays a bell-shaped response curve to intracellular calcium concentrations. The
  receptor activation level is maximal when intracellular calcium concentration is approximately
  . However, more (and less) calcium reduces
  receptor activation. To represent this regulation, two complementary arrows represent activation and inhibition from calcium to
  receptor in this diagram. In addition, one arrow originates from Ser137 and terminates at an arrow from PP2B to Thr34. Phosphorylation of Ser137 decreases the rate of Thr34 dephosphorylation by PP2B. Therefore, Ser137 contributes to disinhibition of the PP2B-Thr34 pathway . The arrow from Ser137 represents this effect.
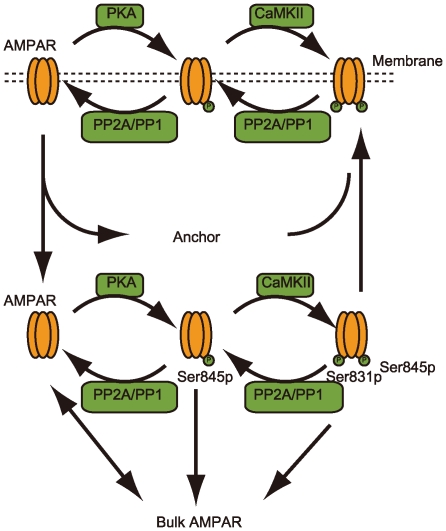
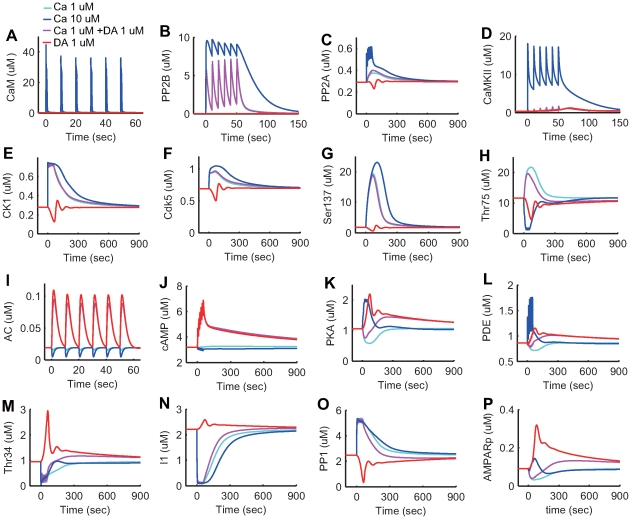
 calcium influx without dopamine input (cyan);
  calcium influx without dopamine input (blue);
  calcium influx coincident with
  dopamine input (magenta); and
  dopamine input in the absence of calcium influx (red). (A–O) Each plot indicates the activation state of each protein. (P) AMPARp indicates total concentration of phosphorylated AMPA receptor from at least one phosphorylation site.
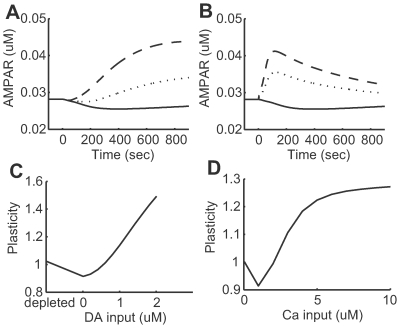
 (solid line),
  (dotted line), and
  (dashed line) dopamine input coincident with
  calcium input. (B) Transient time courses of synaptic efficacy induced by
  (solid line),
  (dotted line), and
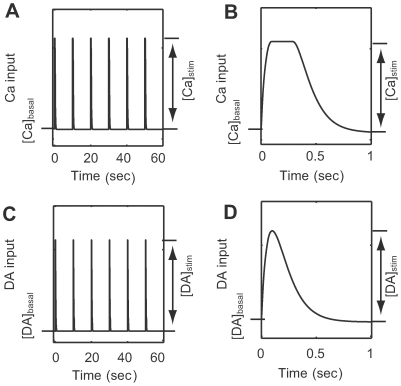
  (dashed line) calcium input without dopamine input. In all cases from (A) and (B), input was initiated at 0 seconds and synaptic efficacy was evaluated by the number of AMPA receptors in the post-synaptic membrane. (C) Synaptic plasticity as a function of dopamine input with
  calcium input. The dopamine concentration was fixed at
  in the depleted condition, but set to
  steady state in the remaining conditions. (D) Synaptic plasticity as a function of calcium input. For (C) and (D), plasticity was evaluated by the ratio of the number of AMPA receptors in the post-synaptic membrane prior to and 10 minutes after stimulation onset.
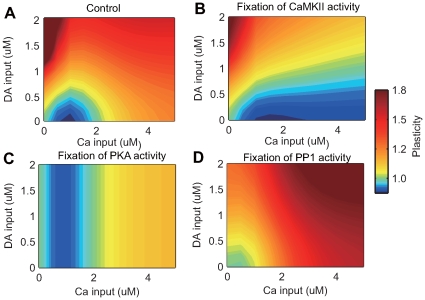
 calcium input; and blue for
  calcium input.
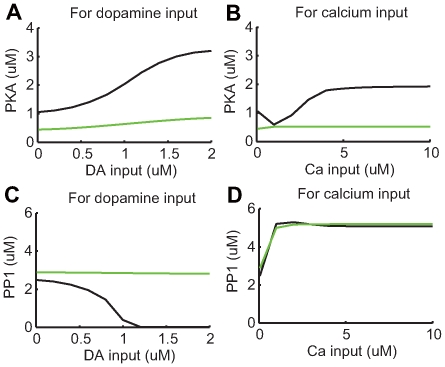
 (DARPP-32 knockout condition).
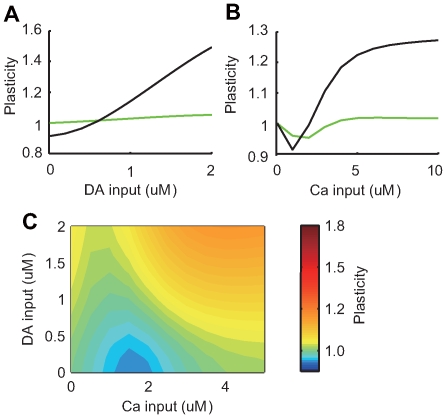
 calcium input. (B) Synaptic plasticity due to varying strengths of calcium input without dopamine input. Black lines indicate results from the original model (control), and green lines indicate results from the modified model, where DARPP-32 is fixed at
  (DARPP-32 knockout condition). (C) Contour plot of synaptic plasticity in the DARPP-32 knockout condition as a function of calcium and dopamine input.
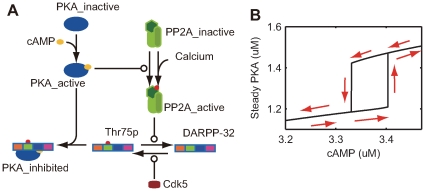
 and Cdk5 at
  . First, cAMP concentration was set to
  , and active PKA steady state was calculated by COPASI. Subsequently, cAMP concentration was increased by a step of
  to
to  , and steady state level of active PKA was calculated at each setting. Next, cAMP concentration was reduced by a step of
  to
to  , and steady state of active PKA was analyzed again. The arrows along the lines show the direction of the trajectory in the two-dimensional space of cAMP conditions and steady states of active PKA.
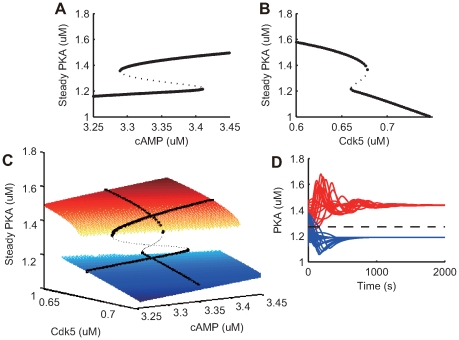
 calcium and
  Cdk5. The subsystem has one stable state when cAMP is less than
  or greater than
  . At middle range of cAMP, three steady states exist: two stable states and one unstable state. (B) Bifurcation diagram for the altered Cdk5, with fixed parameters of
  calcium and
  cAMP. The subsystem has one stable state when Cdk5 is less than
  or greater than
  . At middle range of Cdk5, three steady states exist: two stable states and one unstable state. (C) Steady state level of PKA in the 2D parameter space of cAMP and Cdk5. The calcium concentration was fixed at
  . The blue and red planes are steady states of PKA at low and high levels, respectively. The black dots indicate steady states with Cdk5 fixed at
  or cAMP fixed at
  , as plotted in panels A and B. (D) PKA trajectories from several initial conditions at a cAMP level of
  and Cdk5 level of
  . The trajectories funnel toward a stable steady state. The dotted line indicates PKA levels at an unstable steady state.
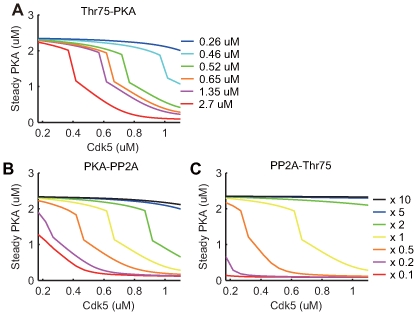
 (blue),
  (cyan),
  (green),
  (orange),
  (magenta) or
  (red); (B) A catalytic constant
  in a reaction where active PKA phosphorylates PP2A, is given by 10 times (black), 5 times (blue), 2 times (green), control (yellow), 0.5 times (orange), 0.2 times (magenta), 0.1 times (red), larger than the control value in the original model (yellow); and (C) A catalytic constant
  in a reaction where active PP2A dephosphorylates Thr75, is given by 10 times (black), 5 times (blue), 2 times (green), control (yellow), 0.5 times (orange), 0.2 times (magenta), 0.1 times (red), larger than the control value in the original model (yellow). Please note that the dissociation constant Kd in panel (A) was set at
  in our original model while it was said to be
  in an experimental study .
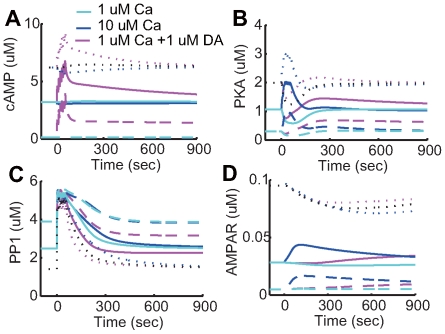
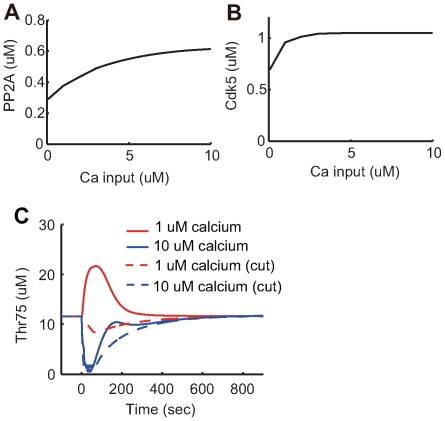
 calcium influx, the blue lines indicate
  calcium influx without dopamine input, and the magenta lines indicate
  calcium influx together with
  dopamine input. The solid lines indicate the
  basal dopamine (control) condition, the dotted lines indicate the
  condition, and the dashed lines indicate the
  basal dopamine (dopamine depletion) condition.
Similar articles
-
Transient calcium and dopamine increase PKA activity and DARPP-32 phosphorylation.PLoS Comput Biol. 2006 Sep 8;2(9):e119. doi: 10.1371/journal.pcbi.0020119. PLoS Comput Biol. 2006. PMID: 16965177 Free PMC article.
-
The Cdk5 inhibitor Roscovitine increases LTP induction in corticostriatal synapses.ASN Neuro. 2014 Mar 19;6(2):e00140. doi: 10.1042/AN20140006. ASN Neuro. 2014. PMID: 24555476 Free PMC article.
-
Subcellular location of PKA controls striatal plasticity: stochastic simulations in spiny dendrites.PLoS Comput Biol. 2012 Feb;8(2):e1002383. doi: 10.1371/journal.pcbi.1002383. Epub 2012 Feb 9. PLoS Comput Biol. 2012. PMID: 22346744 Free PMC article.
-
Regulation of neuronal PKA signaling through AKAP targeting dynamics.Eur J Cell Biol. 2006 Jul;85(7):627-33. doi: 10.1016/j.ejcb.2006.01.010. Epub 2006 Feb 28. Eur J Cell Biol. 2006. PMID: 16504338 Review.
-
Dopaminergic control of synaptic plasticity in the dorsal striatum.Eur J Neurosci. 2001 Mar;13(6):1071-7. doi: 10.1046/j.0953-816x.2001.01485.x. Eur J Neurosci. 2001. PMID: 11285003 Review.
Cited by
-
Conserved BK channel-protein interactions reveal signals relevant to cell death and survival.PLoS One. 2011;6(12):e28532. doi: 10.1371/journal.pone.0028532. Epub 2011 Dec 9. PLoS One. 2011. PMID: 22174833 Free PMC article.
-
Modeling intracellular signaling underlying striatal function in health and disease.Prog Mol Biol Transl Sci. 2014;123:277-304. doi: 10.1016/B978-0-12-397897-4.00013-9. Prog Mol Biol Transl Sci. 2014. PMID: 24560149 Free PMC article. Review.
-
DARPP-32, Jack of All Trades… Master of Which?Front Behav Neurosci. 2011 Sep 8;5:56. doi: 10.3389/fnbeh.2011.00056. eCollection 2011. Front Behav Neurosci. 2011. PMID: 21927600 Free PMC article.
-
Uncertainty-Dependent Extinction of Fear Memory in an Amygdala-mPFC Neural Circuit Model.PLoS Comput Biol. 2016 Sep 12;12(9):e1005099. doi: 10.1371/journal.pcbi.1005099. eCollection 2016 Sep. PLoS Comput Biol. 2016. PMID: 27617747 Free PMC article.
-
Unveiling OASIS family as a key player in hypoxia-ischemia cases induced by cocaine using generative adversarial networks.Sci Rep. 2022 Apr 25;12(1):6734. doi: 10.1038/s41598-022-10772-1. Sci Rep. 2022. PMID: 35469040 Free PMC article.
References
-
- Hikosaka O. Basal ganglia orient eyes to reward. Journal of Neurophysiology. 2005;95:567–584. - PubMed
-
- Balleine BW, Doya K, O'Doherty J, Sakagami M. Current trends in decision making. Ann N Y Acad Sci. 2007;1104:xi–xv. - PubMed
-
- Grace AA. Gating of information flow within the limbic system and the pathophysiology of schizophrenia. Brain Res Brain Res Rev. 2000;31:330–41. - PubMed
-
- Nestler EJ. Molecular basis of long-term plasticity underlying addiction. Nat Rev Neurosci. 2001;2:119–28. - PubMed
Publication types
MeSH terms
Substances
LinkOut - more resources
Full Text Sources
Molecular Biology Databases
Research Materials
