. 2010 Feb 12;6(2):e1000768.
doi: 10.1371/journal.ppat.1000768.

Direct presentation is sufficient for an efficient anti-viral CD8+ T cell response

Affiliations

Direct presentation is sufficient for an efficient anti-viral CD8+ T cell response

Ren-Huan Xu et al. PLoS Pathog. .

Abstract

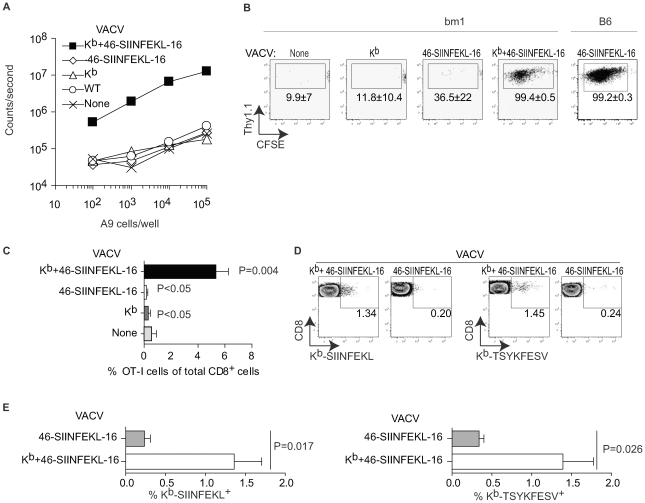
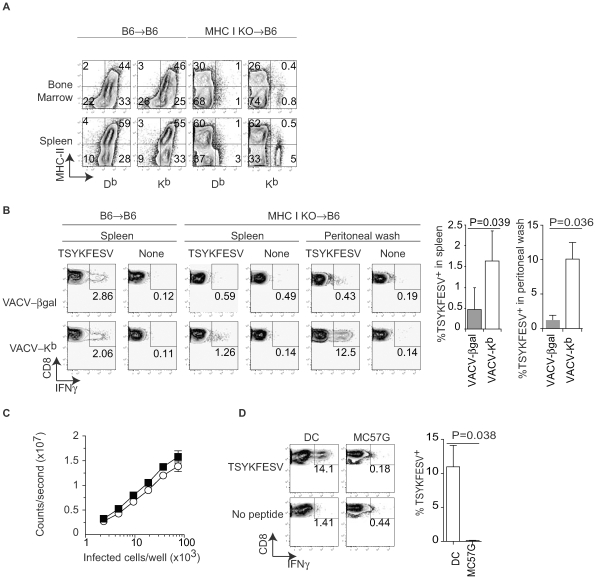
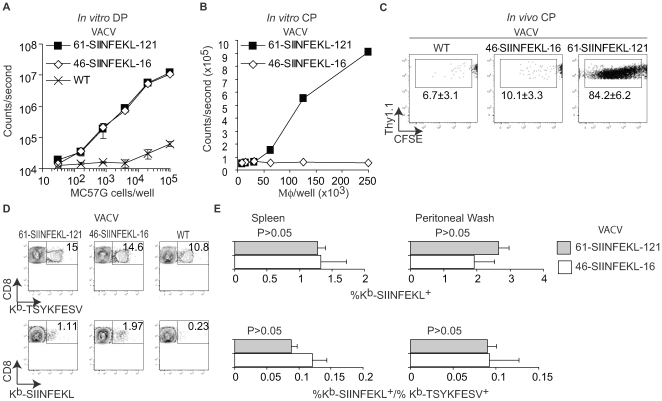
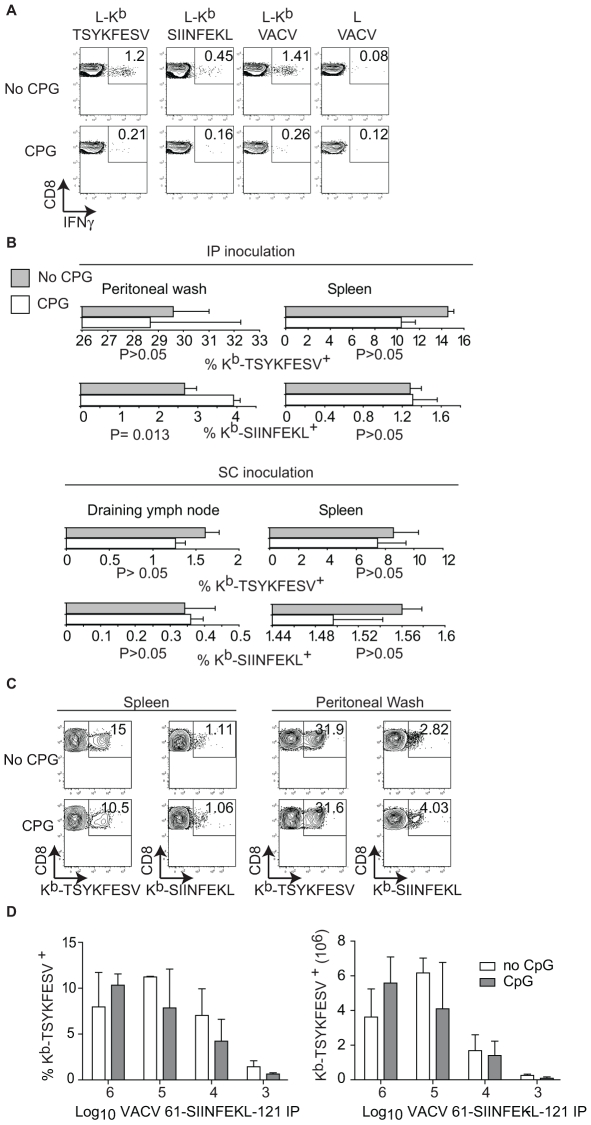
The extent to which direct- and cross-presentation (DP and CP) contribute to the priming of CD8(+) T cell (T(CD8+)) responses to viruses is unclear mainly because of the difficulty in separating the two processes. Hence, while CP in the absence of DP has been clearly demonstrated, induction of an anti-viral T(CD8+) response that excludes CP has never been purposely shown. Using vaccinia virus (VACV), which has been used as the vaccine to rid the world of smallpox and is proposed as a vector for many other vaccines, we show that DP is the main mechanism for the priming of an anti-viral T(CD8+) response. These findings provide important insights to our understanding of how one of the most effective anti-viral vaccines induces immunity and should contribute to the development of novel vaccines.


Conflict of interest statement

The authors have declared that no competing interests exist.

Figures

Figure 1
Figure 1. Direct presentation primes anti-VACV TCD8+.
A) A9 cells (H-2k) were infected with the indicated viruses (10 PFU/cell) for 2 h and Ag presentation determined using the Kb-SIINFEKL specific hybridoma B3Z as previously reported . Data correspond to the average of two wells and is representative of two similar experiments. B) bm1 or B6 mice were adoptively transferred with 106 CFSE labeled OT-I cells and infected IP with 106 PFU of the indicated viruses. OT-I proliferation in the spleen was determined by FACS on day 4 PI. Plots correspond to a pool of three mice and are representative of three experiments. The numbers in the plots are the average ± SEM for the three experiments. C) As in B for bm1 mice but displayed as the % of OT-I cells of the total CD8+ cells in the host. The P values shown are against the uninfected host. D) bm1 mice were infected IP with 106 PFU of the indicated viruses. Seven days later the SIINFEKL and TSYKFESV-specific TCD8+ were determined in the peritoneal wash by staining with the indicated Kb tetramers. Each plot corresponds to a pool of three mice from a representative experiment of three. Data are gated on CD8+ cells. E) Summary data for the three experiments in D. P value determined by one-tailed T test.
Figure 2
Figure 2. Only bone marrow derived cells prime anti-VACV TCD8+ by DP.
A) B6 mice were lethally irradiated (400+500 rads) and reconstituted with bone marrow from MHC I KO mice. Expression for MHC II and MHC I was determined in the indicated organs four months later. Data correspond to one mouse and is representative of three mice/group and three similar experiments. B) The indicated bone marrow chimeric mice were infected IP with 106 PFU of the indicated recombinant VACV. Seven days PI TSYKFESV-specific responses was determined in the spleen and peritoneal wash following restimulation with DC2.4 cells that had been pulsed or not with TSYKFESV. FACS plots correspond to a pool of three mice and are representative of two similar experiments. Data are gated on CD8+ cells. The column graphs on the right are the summary data for the spleen and peritoneal wash of the two experiments. The P values are for one-tailed T test. C) BMD DC and MC57G cells were infected for 2 h with 1 PFU/cell VACV 46-SIINFEKL-16, serially diluted as indicated and Ag presentation determined using the Kb-SIINFEKL specific hybridoma B3Z as previously reported . Data correspond to the average of three wells and is representative of two similar experiments. There was no statistical significance for the small difference observed between the two curves (P = 0.6323 in two-tailed T test). D) MHC I KO →B6 bone marrow chimeric mice were inoculated IP with 106 of the indicated cells that had been infected with 10 PFU/cell WT VACV. Seven days later the TSYKFESV-specific response was determined in the peritoneal wash (following restimulation with DC2.4 cells that had been pulsed or not with TSYKFESV). FACS plots correspond to a pool of three mice and are representative of two similar experiments. Data are gated on CD8+ cells. The column graph on the right summarizes the two experiments. The P value is for a one-tailed T test.
Figure 3
Figure 3. CP is not essential for efficient anti-VACV TCD8+ responses.
A) Direct presentation in vitro: MC57G cells (H-2b) were infected with the indicated viruses (10 PFU/cell) for 2 h and Ag presentation was determined using B3Z cells as in Figure 1. Data correspond to the average of two wells and is representative of two similar experiments. B) Cross presentation in vitro: A9 cell were infected with the indicated viruses (1 PFU/cell) overnight UV irradiated for 2 h on ice, and fixed with paraformaldehyde followed by incubation with 1×10⁶ BM-derived B6 macrophages for 1 h. CP was determined using B3Z cells. C) 5×10⁶ CFSE labeled OT-I cells were transferred to B6 mice. One day later, the mice were injected 5×10⁶ virus-infected UV treated and paraformaldehyde fixed A9 cells (as described in B) subcutaneously. OT-I cell proliferation was determined by FACS in spleen on day 4 PI. The data in the plot corresponds to a pool of three mice and is representative of three experiments. Numbers are the mean ± SD for the three experiments. The differences between WT and 46-SIINFEKL-16 were not significant. The differences between 61-SIINFEKL-121 and WT had P<0.00003 by one-tailed T test. Data are gated on CD8+ and Thy 1.1 + cells. D) C57BL/6 mice were infected with 1×10⁶ PFU of the indicated viruses IP. Seven days PI the SIINFEKL- and TSYKFESV-specific TCD8+ was determined in the spleen and peritoneal wash by staining with the indicated Kb tetramers. Data correspond to a representative mouse of three and is representative of three experiments. Data is gated on CD8+ cells. E) Quantification of D. Upper panels shows the percentage of Kb-SIINFEKL specific TCD8+ of total CD8+ cells in spleen and peritoneal wash, and lower panel shows the data normalized as (%Kb-SIINFEKL+ TCD8+/% Kb-TSYKFESV + TCD8+). The data represents means ± SD of three mice. There was not statistically significant differences by T test analysis between the mice infected with 61-SIINFEKL-121 vs. 46-SIINFEKL-16.
Figure 4
Figure 4. TLR-ligands do not block the TCD8+ response to live VACV.
A) A9 cells infected with VACV 61-SIINFEKL-121 UV treated and fixed with 2% paraformaldehyde were inoculated to mice previously inoculated i.v. with PBS (mock, upper panels) or CpG (lower panels). Seven days PI the splenocytes of these mice were restimulated for 4 h in vitro with L cells transfected with Kb (L-Kb) or control Kb-negative L cells (L cells) that had been either pulsed with SIINFEKL or TSYKFESV; or infected with VACV. Following restimulation, the cells were stained as indicated and analyzed by FACS. Data represent a pool of three mice. Data is gated on CD8+ cells. B) Quantification of Kb-SIINFEKL and Kb–TSYKFESV tetramer+ cells in the spleen and peritoneal wash (IP inoculation) or spleen and D-LN (SC inoculation) in mice that had been inoculated i.v. with PBS (gray bars) or CPG (white bars) and infected with 106 PFU of VACV 61-SIINFEKL-121 IP. Data are the average ± SEM of three mice and representative of three similar experiments. P values by two-tailed T test. C) Representative examples from individual mice in B inoculated IP. Data are gated on CD8+ cells. D) Relative (left, as a percent of total TCD8+) and absolute (right) numbers of Kb–TSYKFESV tetramer+ cells in spleen of mice inoculated IP with the indicated doses of VACV 61-SIINFEKL-121 stained 7 days PI. Data correspond to three mice/group and are from an experiment different to that in B and C. No statistically significant differences were found by two-tailed T test analysis comparing CpG treated and non-treated mice with any of the virus doses.

Similar articles

Cited by

References

    1. Lau LL, Jamieson BD, Somasundaram T, Ahmed R. Cytotoxic T-cell memory without antigen. Nature. 1994;369:648–652. - PubMed
    1. Welsh RM, Selin LK, Szomolanyi-Tsuda E. Immunological memory to viral infections. Annu Rev Immunol. 2004;22:711–743. - PubMed
    1. Fang M, Sigal LJ. Antibodies and CD8+ T Cells Are Complementary and Essential for Natural Resistance to a Highly Lethal Cytopathic Virus. J Immunol. 2005;175:6829–6836. - PubMed
    1. Xu R-H, Fang M, Klein-Szanto A, Sigal LJ. Memory CD8+ T cells are gatekeepers of the lymph node draining the site of viral infection. Proc Natl Acad Sci U S A. 2007;104:10992–10997. - PMC - PubMed
    1. Lenz LL, Butz EA, Bevan MJ. Requirements for bone marrow-derived antigen-presenting cells in priming cytotoxic T cell responses to intracellular pathogens. J Exp Med. 2000;192:1135–1142. - PMC - PubMed

Publication types