. 2010 Feb 12;6(2):e1000777.
doi: 10.1371/journal.ppat.1000777.

Kaposi's sarcoma associated herpes virus (KSHV) induced COX-2: a key factor in latency, inflammation, angiogenesis, cell survival and invasion

Affiliations

Kaposi's sarcoma associated herpes virus (KSHV) induced COX-2: a key factor in latency, inflammation, angiogenesis, cell survival and invasion

Neelam Sharma-Walia et al. PLoS Pathog. .

Abstract

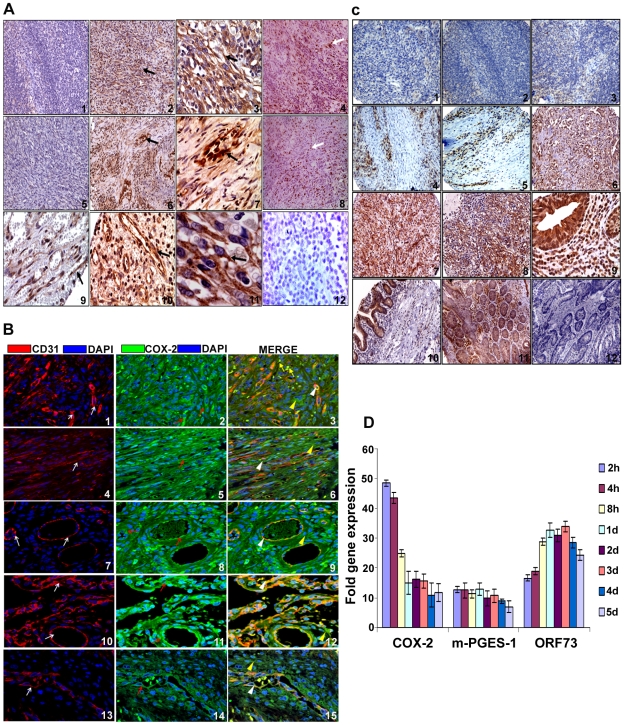
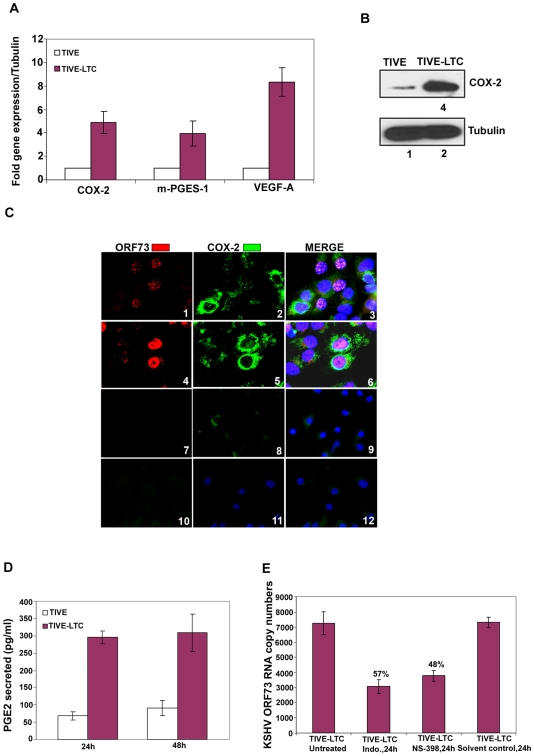
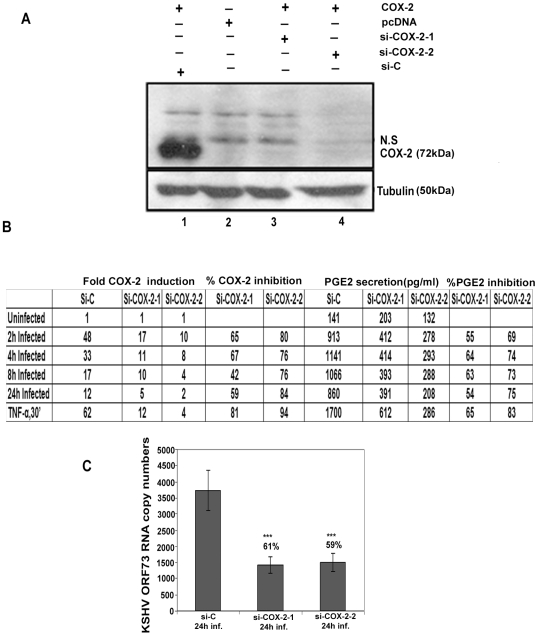
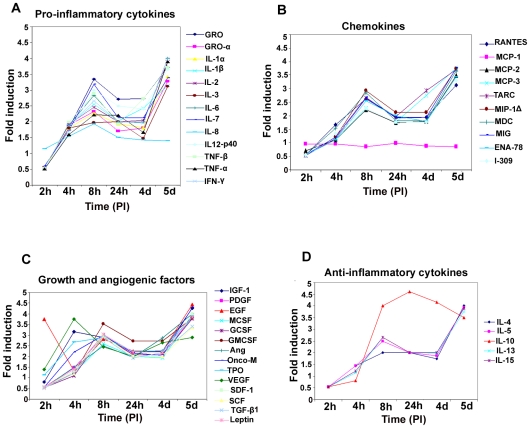
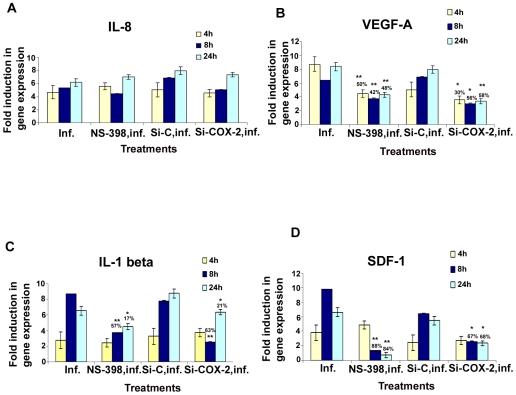
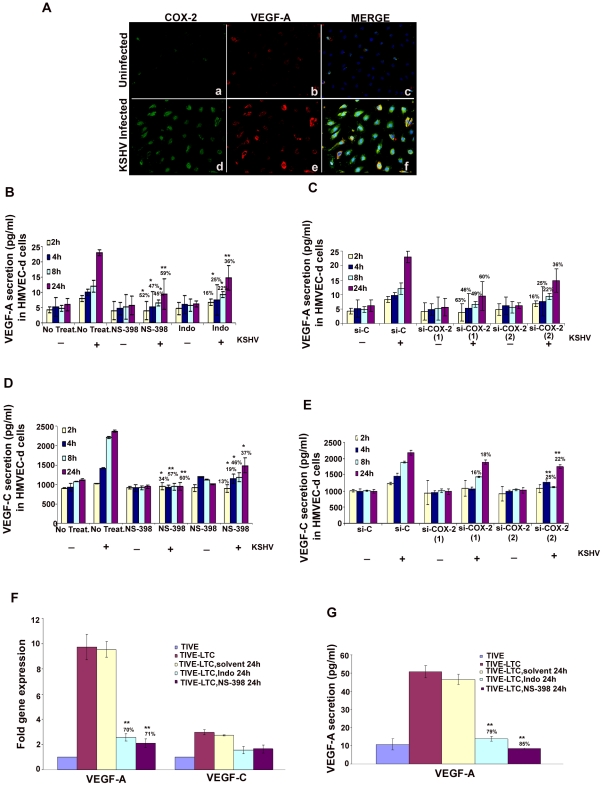
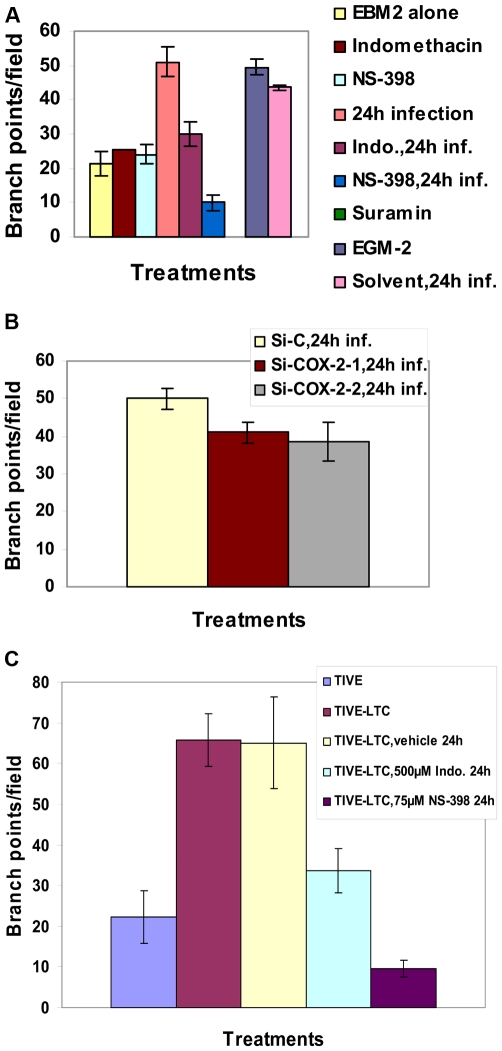
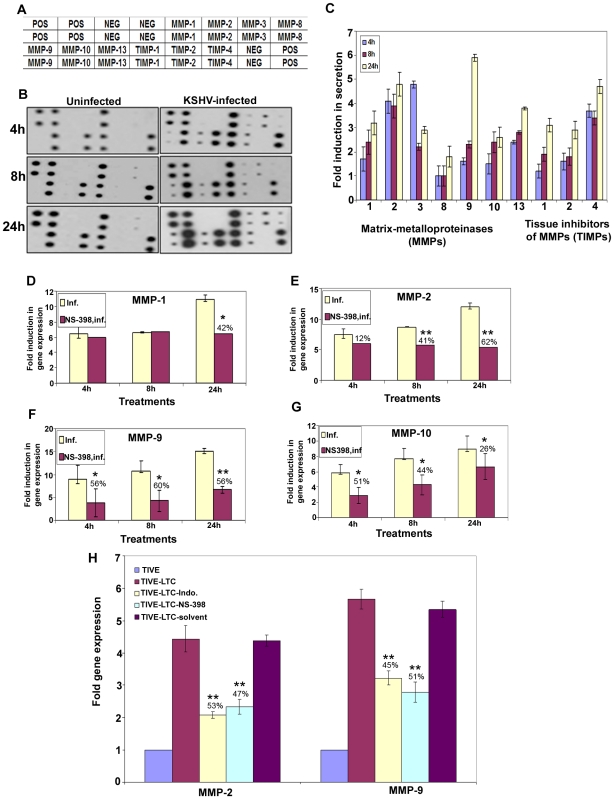
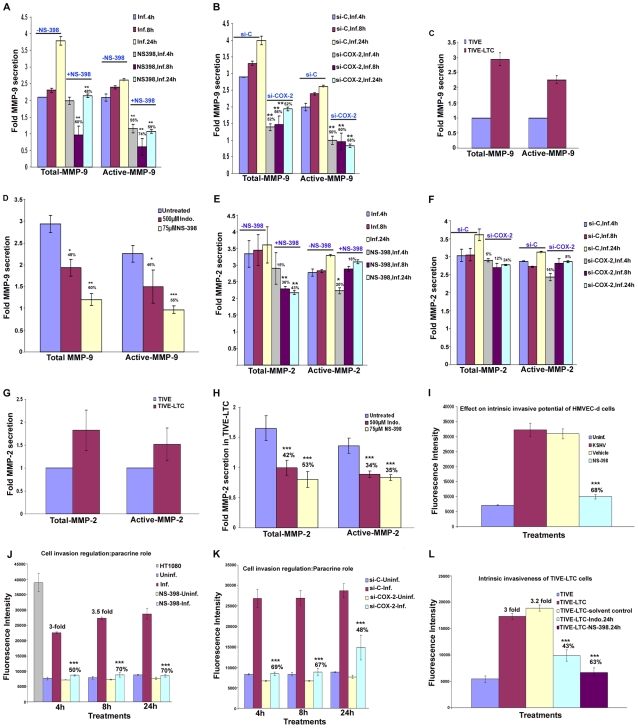
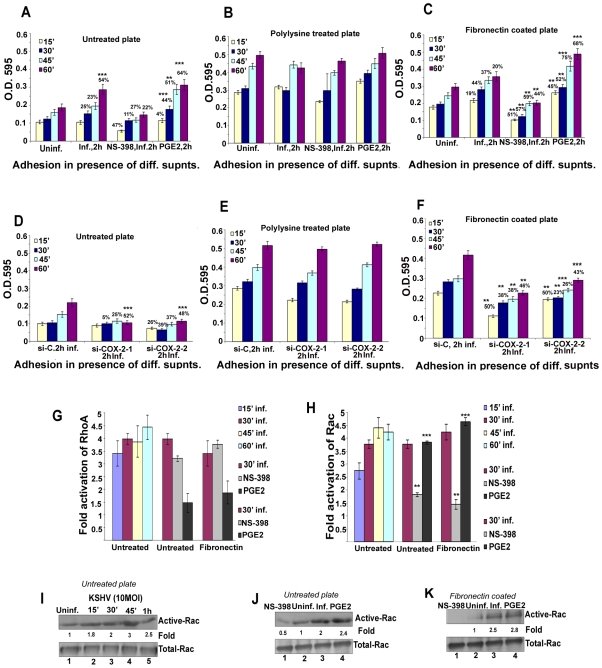
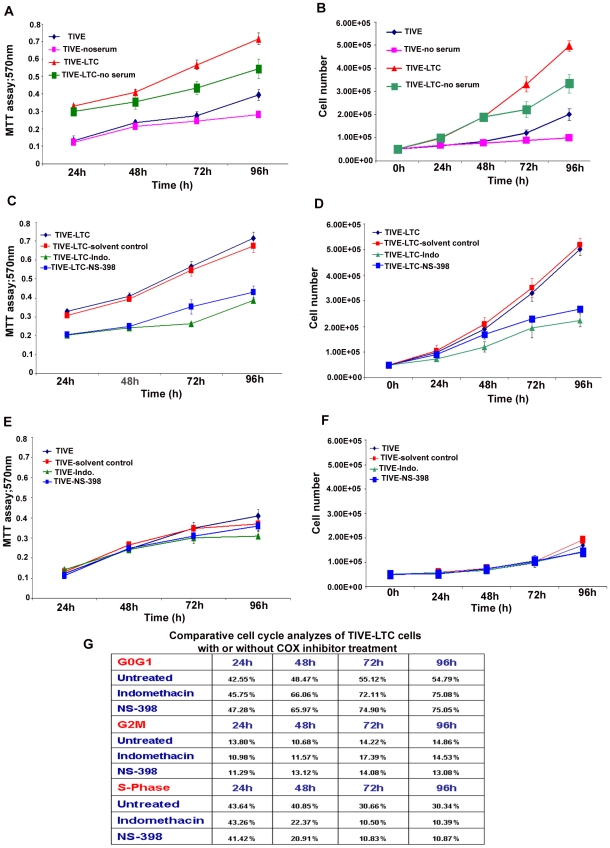
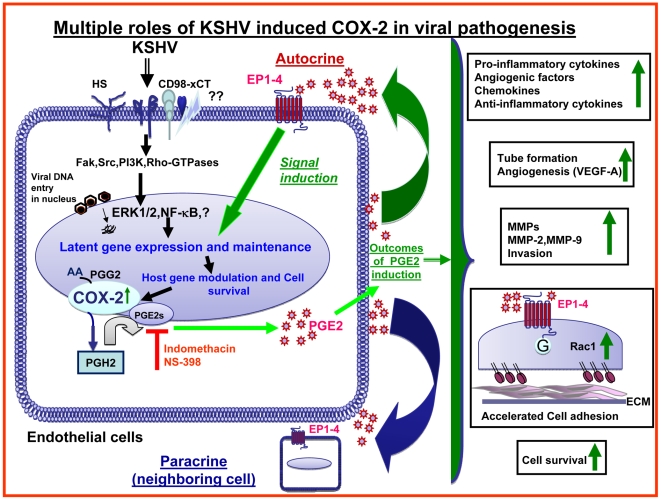
Kaposi's sarcoma (KS), an enigmatic endothelial cell vascular neoplasm, is characterized by the proliferation of spindle shaped endothelial cells, inflammatory cytokines (ICs), growth factors (GFs) and angiogenic factors. KSHV is etiologically linked to KS and expresses its latent genes in KS lesion endothelial cells. Primary infection of human micro vascular endothelial cells (HMVEC-d) results in the establishment of latent infection and reprogramming of host genes, and cyclooxygenase-2 (COX-2) is one of the highly up-regulated genes. Our previous study suggested a role for COX-2 in the establishment and maintenance of KSHV latency. Here, we examined the role of COX-2 in the induction of ICs, GFs, angiogenesis and invasive events occurring during KSHV de novo infection of endothelial cells. A significant amount of COX-2 was detected in KS tissue sections. Telomerase-immortalized human umbilical vein endothelial cells supporting KSHV stable latency (TIVE-LTC) expressed elevated levels of functional COX-2 and microsomal PGE2 synthase (m-PGES), and secreted the predominant eicosanoid inflammatory metabolite PGE2. Infected HMVEC-d and TIVE-LTC cells secreted a variety of ICs, GFs, angiogenic factors and matrix metalloproteinases (MMPs), which were significantly abrogated by COX-2 inhibition either by chemical inhibitors or by siRNA. The ability of these factors to induce tube formation of uninfected endothelial cells was also inhibited. PGE2, secreted early during KSHV infection, profoundly increased the adhesion of uninfected endothelial cells to fibronectin by activating the small G protein Rac1. COX-2 inhibition considerably reduced KSHV latent ORF73 gene expression and survival of TIVE-LTC cells. Collectively, these studies underscore the pivotal role of KSHV induced COX-2/PGE2 in creating KS lesion like microenvironment during de novo infection. Since COX-2 plays multiple roles in KSHV latent gene expression, which themselves are powerful mediators of cytokine induction, anti-apoptosis, cell survival and viral genome maintainence, effective inhibition of COX-2 via well-characterized clinically approved COX-2 inhibitors could potentially be used in treatment to control latent KSHV infection and ameliorate KS.


Conflict of interest statement

The authors have declared that no competing interests exist.

Figures

Figure 1
Figure 1. COX-2 expression.
(A) COX-2 expression in KS tissue. Samples were analyzed by immunohistochemical staining for COX-2 (panels 1–3, 5–7, 9–11), anti-ORF73 (panels 4 and 8) and isotype control antibody alone (panel 12) and counterstained with hematoxylin. Arrow (black) in all the panels (2, 3, 6, 7, 9, 10 and 11) indicates COX-2 staining. Arrow (white) in panels 4 and 8 indicates ORF73 staining. Magnifications: panels 1, 2, 4–6 and 8: 20X; panels 3, 7, 9–12: 60X. Magnified views are given in Figure S1. (B) COX-2 and CD31 double staining in KS skin and lymph node sections. Samples were analyzed by immunofluoresence staining for COX-2 and CD31 staining in KS skin (panels 1–6) and lymph node sections (panels 7–15). Red arrows indicate COX-2 (green) staining (panels 2, 5, 8, 11 and 14). White arrows indicate CD31 (red) staining (panels 1, 4, 7, 10 and 13). White arrow heads indicate areas of COX-2 and CD31 co-staining in the same cells (panels 3, 6, 9, 12 and 15). Yellow arrow heads indicate cells staining for COX-2 but not CD31 (panels 3, 6, 9, 12 and 15). Yellow arrows depict COX-2 staining cells with no spindle phenotype or endothelial cell morphology (panel 3). (C) COX-2 expression in various tissues of KS patients. ACSR-KS Screening TMA 09-1 tissue sections had sections from skin (panels 1, 2, 4 and 5), mouth (panels 3 and 8), eye orbit (panel 6), tonsil (panel 7) small bowel (panels 9 and 10) as well as tongue, anus, nasopharynx, rectal mucosa, epiglottis, hypopharynx, soft tissue mass, lung and gastric mucosa (Table S1). Brown color indicates COX-2 staining (panels 1 to 10). Panels 11 and 12 are colon cancer tissue stained with COX-2 antibody or IgG control for COX-2 antibody, respectively. Magnifications: panels 1–8: 20X; panels 9–12: 60X. (D) Induction of COX-2 and m-PGES-1 during de novo KSHV infection. HMVEC-d cells grown to 80–90% confluence were serum starved for 8h and infected with 30 DNA copies/ cell of KSHV. Total RNA from infected and uninfected cells was DNase-1 treated and subjected to q-RT-PCR using ORF73, COX-2 and m-PGES-1 gene specific primers using the ΔΔCt method. Ct value obtained for ORF73 in uninfected cells (mostly close to non template control) was used for calculating fold inductions. Fold induction was calculated by considering induction in uninfected cells at respective times as 1-fold. Each bar represents the average ± SD of three independent experiments.
Figure 2
Figure 2. COX-2 in latently infected TIVE-LTC cells.
(A) Expression of COX-2, m-PGES-1 and VEGF-A. TIVE and TIVE-LTC (KSHV) cells were used to prepare total RNA and the expression of host genes like COX-2, m-PGES-1 and VEGF-A (A) were analyzed using the ΔΔCt method. Fold induction was calculated by considering expression in TIVE cells as 1-fold. (B) Protein levels of COX-2. Lysates from 24h serum starved TIVE and TIVE-LTC cells were Western blotted for COX-2, stripped and immunoblotted for tubulin and a representative blot from three independent experiments is shown. (C) Immunofluoresence analysis of ORF73 and COX-2. TIVE and TIVE-LTC cells were grown to 80–90% confluence, serum starved for 24 h, fixed, permeabilised and examined with ORF73 (red) and COX-2 (green) specific antibodies. (D) PGE2 secretion. Conditioned media from 24 h or 48 h serum starved TIVE and TIVE-LTC cells were measured for secreted PGE2 levels using a PGE2 ELISA. (E) Effect of inhibitors on ORF73 gene expression. TIVE-LTC cells were untreated, solvent control treated or treated with 500 µM Indo or 75 µM NS-398 for 24 h. RNA was isolated and viral transcripts were quantitated. The % inhibition was calculated by considering KSHV-ORF73 gene expression in untreated TIVE-LTC cells as 100%. Each point represents the average ± SD from three independent experiments (A, D, and E).
Figure 3
Figure 3. Evaluation of COX-2 siRNA for silencing COX-2.
(A) Two constructs, si-COX-2 -1 and si-COX-2-2 expressing siRNAs for COX-2 were generated. Lysates from 293T cells co-transfected with COX-2 expression plasmid and si-COX-2-1 (lane 3) or si-COX-2-2 (lane 4) or si-C (lane 1) (36 h) were Western blotted for COX-2, stripped and immunoblotted for tubulin. Lysate prepared from 293T cells transfected with pcDNA alone was used as control (lane 2). N.S =  non-specific band. (B) HMVEC-d cells transduced for 48 h with si-C or si-COX-2-1 or si-COX-2-2 were serum starved for 8 h, and infected with KSHV for 2, 4, 8 and 24 h or stimulated with TNFα (20 ng/ml) for 30′. RNA from these cells was analyzed by q-RT-PCR for COX-2 expression and the supernatants were used to quantify PGE2 concentration by ELISA. Panel B represents the fold induction of COX-2 gene expression calculated by considering expression in uninfected cells as 1 fold. Similarly, PGE2 levels in quadruplicate samples were measured and values are presented in pg/ml. % inhibition was calculated by considering COX-2 expression or PGE2 release from the infected cells at the respective time of measurement as 100%. Data is from four independent experiments. (C) Effect of COX-2 silencing on KSHV ORF73 gene expression. HMVEC-d cells were transduced with si-C, si-COX-2-1 and si-COX-2-2 and after 48 h, serum starved for 8 h and infected with 30 DNA copies/ cell of KSHV for 24 h. RNA was isolated and treated with DNase I, and 250 ng of DNase-treated RNA was subjected to real-time RT-PCR with KSHV ORF73 gene-specific primers and TaqMan probes. The relative copy numbers of viral transcripts were calculated using a standard graph generated by using known concentrations of DNase-1 treated, in vitro-transcribed ORF73 transcripts in real-time RT-PCR and normalized with GAPDH. Each reaction was done in duplicate, and each point represents the average ± SD from three independent experiments. The % inhibition was calculated by considering KSHV-ORF73 gene expression in 24 h infected si-C HMVEC-d cells as 100%.
Figure 4
Figure 4. Induction of pro-inflammatory cytokines, chemokines, growth, angiogenic factors, and anti-inflammatory cytokines in HMVEC-d cells by KSHV infection.
Densitometric analysis of cytokine array blots was carried out to determine the differences in the release of cytokines from serum-starved, uninfected HMVEC-d cells and cells infected with KSHV for 2 h, 4 h, 8 h, 24 h, 4 days and 5 days. The values were normalized to identical background levels using the Ray-Biotech Array 3.1 analysis tools. The increase in cytokine levels was calculated by dividing the respective values obtained from infected-cell supernatants with the values obtained from uninfected-cell supernatants and cytokines showing significant changes with respect to uninfected cells are represented in a line graph format. (A) Pro-inflammatory cytokines; (B) chemokines; (C) growth and angiogenic factors; (D) anti-inflammatory cytokines.
Figure 5
Figure 5. Effect of NS-398 or COX-2 silencing on KSHV infection induced cytokine gene expression.
Histograms depict the fold induction in gene expression of KSHV infected, or NS-398 pretreated for 1 h and then infected with KSHV, or si-COX-2-2-HMVEC-d/si-C-HMVEC-d cells infected with 30 DNA copies/ cell of KSHV for 4 h, 8 h, and 24 h. IL-8 (A), VEGF-A (B), IL-1β (C), SDF-1 (D). The % inhibition was calculated by considering cytokine gene expression in the infected cells at the respective time of measurement as 100%. Each reaction was done in quadruplicate, and each bar represents the average ± SD of four independent experiments. *,**, ***-statistically significant at p<0.01, p<0.005 and p<0.001 respectively.
Figure 6
Figure 6. Role of COX-2 in KSHV-induced VEGF-A and C.
(A) Immunofluorescence analysis of COX-2 and VEGF-A expression in uninfected HMVEC-d and KSHV infected cells (24 h PI) using COX-2 and VEGF-A specific antibodies. (B-E) Conditioned media from serum-starved uninfected HMVEC-d cells, KSHV infected cells, cells incubated with COX-2 specific inhibitor NS-398 or non-COX isotype selective inhibitor Indo and from cells silenced for COX-2 or lamin (control) and then infected were collected and analyzed by ELISA for the released VEGF-A (B, C) and VEGF-C (D, E) proteins. Each reaction was done in quadruplicate, and each point represents the average ± SD from four independent experiments. Data was normalized to 1 mg/ml total protein concentration in the supernatant. Proteins secreted from uninfected cells were considered 1-fold. % inhibition of VEGF-A and VEGF-C secretion was calculated by considering the release from the infected cells at the respective time of measurement as 100%. (F) VEGF-A and VEGF-C gene expression as measured by q-RT-PCR with cDNA prepared from serum starved (24 h) TIVE-LTC cells untreated or treated with either 500 µM Indo or 75 µM NS-398 for 24 h. Result shows the mean ± S.D of three independent experiments. % inhibition in gene expression upon inhibitor treatment was calculated using gene expression in untreated TIVE-LTC cells as 100%. (G) Conditioned media from serum-starved (24 h) TIVE-LTC cells untreated or treated with either 500 µM Indo or 75 µM NS-398 for 24 h were collected and analyzed by ELISA for the released VEGF-A. Each reaction was done in quadruplicate, and each point represents the average ± SD from four independent experiments. Data was normalized to 1 mg/ml total protein concentration in the supernatant. Proteins secreted from untreated TIVE-LTC cells were considered 100%.*, **, ***-statistically significant at p<0.01, p<0.005 and p<0.001 respectively.
Figure 7
Figure 7. Effect of COX-2 inhibition on KSHV infection-induced capillary tube formation in normal HMVEC-d cells.
(A and B) Quantitative representation for branch points/field in the presence of supernatants obtained from HMVEC-d cells treated with COX-2 inhibitors or solvent control, or cells pretreated with COX-2 inhibitors and then infected (24 h) or cells silenced for COX-2 and then infected for 24h. Percent inhibition was calculated by considering the branch points/field observed in the presence of KSHV infected supernatant or the supernatant obtained from infected si-C-HMVEC-d as 100%.***-statistically significant at p<0.001. (C) Quantitative representation for branch points/field in the presence of conditioned medium obtained from 24 h serum starved TIVE cells and COX-2 inhibitors or solvent pretreated or untreated TIVE-LTC cells. Percent inhibition was calculated by considering the branch points observed in the absence of COX inhibitor treatment in TIVE-LTC cells as 100%. Fold increase in the branch points/field was calculated considering branch points/field in presence of TIVE cell supernatant as 1 fold.
Figure 8
Figure 8. KSHV induced COX-2 regulates MMP gene expression in HMVEC-d as well as latently infected endothelial cells.
(A) Scheme of MMPs on MMP array-1. (B) Representative MMP arrays showing the signals for various MMPs in the conditioned medium obtained from serum starved uninfected HMVEC-d cells or cells infected with 30 DNA copies/ cell of KSHV for 4 h, 8 h, and 24 h. (C) Densitometric analysis of MMP array blots measuring the release of human MMPs. The values were normalized to identical background levels using the Ray Biotech Human MMP antibody array 1 analysis tool. The fold induction in MMP secretion was calculated by dividing the respective values obtained from infected-cell supernatants with the values obtained from uninfected-cell supernatants. Each point represents the average ± SD from three independent experiments. (D, E, F and G) MMP gene expression. MMP-1 (D), MMP-2 (E), MMP-9 (F), and MMP-10 (G) gene expression was measured by q-RT-PCR with cDNA prepared from serum starved (8h) HMVEC-d cells infected or NS-398 treated (1h), and then infected with KSHV for 4h, 8h, and 24h. Result shows the mean ± S.D of three independent experiments. % inhibition in gene expression upon NS-398 treatment was calculated using gene expression in the presence of KSHV infected HMVEC-d cells at different time points as 100%. (H) MMP-2 and MMP-9 gene expression in TIVE-LTC cells upon COX inhibitor treatment. Gene expression was measured by q-RT-PCR with cDNA prepared from serum starved (24h) TIVE-LTC cells untreated or treated with either 500 µM Indo or 75 µM NS-398 for 24h. Result shows the mean ± S.D of three independent experiments. % inhibition in gene expression upon inhibitor treatment was calculated using gene expression in untreated TIVE-LTC cells as 100%. *, **, ***-statistically significant at p<0.01, p<0.005 and p<0.001 respectively.
Figure 9
Figure 9. Effect of COX-2 inhibition on activity of MMPs and invasion of de novo infected HMVEC-d and latently infected TIVE-LTC cells.
(A) Activation of MMP-9 measured by the MMP-9 assay kit in uninfected HMVEC-d cells, untreated KSHV infected, uninfected NS-398 treated or NS-398 pretreated and then infected with KSHV for 4h, 8h, and 24h. Total MMP-9 reflects the pool of pro-form and active form of MMP-9 whereas active MMP-9 exclusively represents the active protease. % inhibition of MMP-9 levels (total or active) upon NS-398 treatment was calculated considering MMP-9 levels (total or active) in the presence of KSHV infected HMVEC-d at different time points as 100%. (B) Activation of MMP-9 in the uninfected (4h, 8h, and 24h), KSHV infected (4h, 8h, and 24h) si-C-HMVEC-d and si-COX-2-HMVEC-d cells. % inhibition of MMP-9 levels (total or active) in si-COX-2-HMVEC-d were calculated considering MMP-9 levels (total or active) in KSHV infected si-C-HMVEC-d at different time points as 100%. (C) Similarly, activation of MMP-9 in conditioned medium obtained from 24h serum starved TIVE and TIVE-LTC cells was performed. The levels of total and active MMP-9 in TIVE cells were considered 1 fold for comparison. (D) Activation of MMP-9 in the TIVE-LTC untreated or treated with 500 µM Indo or 75 µM NS-398 for 24h. % inhibition in these protease levels (total or active) upon COX inhibition was calculated considering MMP-9 levels (total or active) in untreated TIVE-LTC cells as 100%. (E-H) Activation of MMP-2 was measured in the conditioned media described in A-D using an MMP-2 assay kit. Method of estimation and analysis was similar to A-D. COX-2 regulates KSHV infected HMVEC-d cell invasion via autocrine and paracrine mechanisms. (I) Effect of KSHV infection and COX-2 regulation upon the invasive potential of endothelial cells was measured by a fluorescence based invasion assay as described in Materials and Methods. Fluoresence intensity is presented and the values shown are the mean± S.D of three independent experiments. % Inhibition in invasion by NS-398 treatment was calculated considering invasion in the presence of KSHV infection as 100%. Fold induction in invasion upon KSHV infection was calculated by considering invasion of the uninfected cells as 1 fold. (J) Invasion of HMVEC-d cells in the presence of supernatant from treated HMVEC-d cells. Histogram represents the fluorescence intensity (mean± S.D of three independent experiments) of HMVEC-d cells invaded in the presence of conditioned media obtained from uninfected, KSHV infected, uninfected NS-398 treated, NS-398 pretreated and then KSHV infected for 4 h, 8 h and 24 h. HT1080 cells were used as positive control and were allowed to invade for 24 h. % Inhibition in invasion upon NS-398 treatment was calculated considering invasion in the presence of KSHV infection at the indicated time point as 100%. Fold increase in invasion upon KSHV infection was calculated by considering invasion in the presence of medium from uninfected cells at the same time as 1 fold. (K) Histogram represents the fluorescence intensity of HMVEC-d cells invaded in the presence of conditioned media obtained from uninfected, KSHV infected si-C-HMVEC-d and si-COX-2-HMVEC-d cells at 4 h, 8 h and 24h. % Inhibition of invasion in si-COX-2-HMVEC-d cells was calculated considering invasion in the presence of si-C-HMVEC-d cells at indicated time points as 100%. Fold increase in invasion upon KSHV infection in si-C-HMVEC-d cells was calculated by considering invasion in the presence of medium from uninfected si-COX-2-HMVEC-d cells at the same time as 1 fold. (L) Effect of COX-2 inhibition on invasion of TIVE, TIVE-LTC cells in the presence of COX inhibitors. The invasive cells were dislodged from the underside of the cell culture insert and stained with a fluorescent dye in a single step and fluorescence was determined using a fluorimeter as described before. Fluorescence associated with the invaded cells is shown and the values correspond to the mean± S.D of three independent experiments. Fold increase in the invasion of TIVE-LTC cells was calculated using the invasive potential of TIVE cells as 1 fold. *, **, ***-statistically significant at p<0.01, p<0.005 and p<0.001 respectively.
Figure 10
Figure 10. Measurement of endothelial cell adhesion.
HMVEC-d cells were allowed to adhere on untreated (A, D), polylysine (B, E), or fibronectin (C, F) coated plates in the absence or presence of culture supernatants obtained from uninfected HMVEC-d cells (2 h), KSHV infected (2 h), NS-398 treated and then KSHV infected cells, or in the presence of serum free medium containing PGE2 (A, B and C) and adhesion kinetics were done at the indicated time points. A similar experiment was done using the supernatants obtained from uninfected or infected (2 h) si-C-HMVEC-d, si-COX-2 (1)-HMVEC-d, or si-COX-2 (2)-HMVEC-d cells (D, E and F). Adhered cells were photographed (pictures not shown). Unattached cells were removed by washing and attached cells were fixed using 4% paraformaldehyde at the indicated times and visualized by crystal violet staining. Results are provided as optical density (O.D.) and represent the mean of triplicate determinations ± S.D. (G and H) Histograms representing RhoA-GTPase (G) or Rac1-GTPase (H) activation in HMVEC-d cells in the presence of various supernatants (as mentioned in results) for the indicated time points on either untreated or fibronectin coated plates and measured by GLISA. Fold activation of RhoA and Rac1 is calculated by considering RhoA or Rac1-GTPase activity in the presence of uninfected cell culture supernatant as 1 fold. Each reaction was done in triplicate, and each bar represents the mean ± S.D. for three experiments. (I, J and K) Representative gels depicting Rac1-GTPase activation in HMVEC-d cells plated in the presence of various supernatants (as mentioned in results) for indicated time points on either untreated or fibronectin coated plates and measured using a PAK pull-down assay. Fold change of Rac1 activation is calculated by determining the band intensities and are expressed as fold increase over the cells plated in the presence of uninfected culture supernatant taken as 1- fold. Each blot is representative of a minimum of three separate experiments. **, ***-statistically significant at p<0.005 and p<0.001 respectively.
Figure 11
Figure 11. Effect of COX-2 inhibition on cell survival and cell cycle profile of latently infected TIVE-LTC cells.
(A, C and E) COX inhibition reduces TIVE-LTC cell proliferation. MTT assay results shown in each panel represent the absorption at 570 nm with TIVE or TIVE-LTC cells. Cells were incubated in the presence or absence of serum or presence of 500 µM Indo, 75 µM NS-398, or solvent control for 24 h-96 h. (B, D and F) COX regulates cell viability in TIVE-LTC cells. Panels show the number of viable cells using a trypan blue exclusion assay. TIVE or TIVE-LTC cells were incubated in the presence or absence of serum in the presence of 500 µM Indo or 75 µM NS-398, or solvent control for 24 h-96 h. (G) Comparative effects of indomethacin and NS-398 on the proliferative profile of TIVE-LTC cells. Cell sorter analysis was performed using TIVE-LTC cells cultured in the presence and absence of indicated drugs. Propidium iodide staining of untreated, 500 µM Indo or 75 µM NS-398 treated TIVE-LTC cells was done for 24 h-96 h. The percentages of cells at specific cell-cycle phases are indicated and the numbers represent mean values of six independent experiments.
Figure 12
Figure 12. Schematic diagram depicting the multiple outcomes of KSHV induced COX-2 in endothelial cells, consequences and role in pathogenesis.
In vitro KSHV infection of HMVEC-d cells involves binding of the virus to the cell surface heparan sulfate (HS) molecules via its envelope glycoproteins gpK8.1A and gB ,,,, followed by interaction with integrins and xCT molecules. Virus interaction with target cell triggers pre-existing signal cascades facilitating virus entry, delivery of viral genome into the target cell nucleus and reprograms host gene expression required for various growth, angiogenic and invasive factors and one which being COX-2 . Data presented here show appreciable COX-2 gene expression at 5d PI of endothelial cells, in latently infected TIVE-LTC cells and in KS lesions. COX-2 catalyzes the synthesis of PGH2 from arachidonic acid (AA) through an unstable intermediate PGG2 . PGH2 is converted by mPGES to PGE2, which is released to the infected cell supernatant where it can mediate its downstream effects through either an autocrine or paracrine mechanism on a neighboring infected or uninfected cell via their interactions through the family of seven transmembrane G-protein-coupled rhodopsin-type EP (1–4) receptors. KSHV induced COX-2 regulates multiple events involved in KS pathogenesis such as secretion of pro-inflammatory cytokines, growth and angiogenic factors, anti-inflammatory cytokines, and MMPs and TIMPs. In addition, COX-2 induction also regulated infection related cell adhesion to the ECM, invasion through the matrix and angiogenesis related capillary tube formation. We demonstrated that KSHV infection induced COX-2/PGE2 also stimulates the induction of Rac1-GTPases in adhering endothelial cells. Interestingly, our study also demonstrates that KSHV infection induced COX-2 potentially modulates the survival and proliferation of latently infected endothelial cells. In summary, together with the down-regulation of viral latent gene expression upon COX-2 inhibition, our study suggests that KSHV hijacks host cellular machinery and manipulates cellular inducible angiogenic stress response gene COX-2 to its advantage to aggravate pathogenesis, cell survival and its persistence in the target cell.

Similar articles

Cited by

References

    1. Boshoff C, Weiss RA. Kaposi's sarcoma-associated herpesvirus. Adv Cancer Res. 1998;75:57–86. - PubMed
    1. Dupin N, Fisher C, Kellam P, Ariad S, Tulliez M, et al. Distribution of human herpesvirus-8 latently infected cells in Kaposi's sarcoma, multicentric Castleman's disease, and primary effusion lymphoma. Proc Natl Acad Sci U S A. 1999;96:4546–4551. - PMC - PubMed
    1. Fidler IJ, Singh RK, Yoneda J, Kumar R, Xu L, et al. Critical determinants of neoplastic angiogenesis. Cancer J. 2000;6(Suppl 3):S225–236. - PubMed
    1. Carmeliet P, Jain RK. Angiogenesis in cancer and other diseases. Nature. 2000;407:249–257. - PubMed
    1. Vart RJ, Nikitenko LL, Lagos D, Trotter MW, Cannon M, et al. Kaposi's sarcoma-associated herpesvirus-encoded interleukin-6 and G-protein-coupled receptor regulate angiopoietin-2 expression in lymphatic endothelial cells. Cancer Res. 2007;67:4042–4051. - PubMed

Publication types

MeSH terms

Substances