Evolution and ecophysiology of the industrial producer Hypocrea jecorina (Anamorph Trichoderma reesei) and a new sympatric agamospecies related to it
- PMID: 20169200
- PMCID: PMC2820547
- DOI: 10.1371/journal.pone.0009191
Evolution and ecophysiology of the industrial producer Hypocrea jecorina (Anamorph Trichoderma reesei) and a new sympatric agamospecies related to it
Abstract
Background: Trichoderma reesei, a mitosporic green mould, was recognized during the WW II based on a single isolate from the Solomon Islands and since then used in industry for production of cellulases. It is believed to be an anamorph (asexual stage) of the common pantropical ascomycete Hypocrea jecorina.
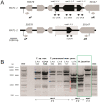
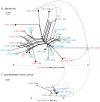
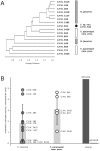
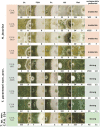
Methodology/principal findings: We combined molecular evolutionary analysis and multiple methods of phenotype profiling in order to reveal the genetic relationship of T. reesei to H. jecorina. The resulting data show that the isolates which were previously identified as H. jecorina by means of morphophysiology and ITS1 and 2 (rRNA gene cluster) barcode in fact comprise several species: i) H. jecorina/T. reesei sensu stricto which contains most of the teleomorphs (sexual stages) found on dead wood and the wild-type strain of T. reesei QM 6a; ii) T. parareesei nom. prov., which contains all strains isolated as anamorphs from soil; iii) and two other hypothetical new species for which only one or two isolates are available. In silico tests for recombination and in vitro mating experiments revealed a history of sexual reproduction for H. jecorina and confirmed clonality for T. parareesei nom. prov. Isolates of both species were consistently found worldwide in pantropical climatic zone. Ecophysiological comparison of H. jecorina and T. parareesei nom. prov. revealed striking differences in carbon source utilization, conidiation intensity, photosensitivity and mycoparasitism, thus suggesting adaptation to different ecological niches with the high opportunistic potential for T. parareesei nom. prov.
Conclusions: Our data prove that T. reesei belongs to a holomorph H. jecorina and displays a history of worldwide gene flow. We also show that its nearest genetic neighbour--T. parareesei nom. prov., is a cryptic phylogenetic agamospecies which inhabits the same biogeographic zone. These two species thus provide a so far rare example of sympatric speciation within saprotrophic fungi, with divergent ecophysiological adaptations and reproductive strategies.
Conflict of interest statement
Figures


References
-
- Harman GE, Kubicek CP. London: Taylor & Francis; 1998. Trichoderma and Gliocladium Vol 2.393
-
- Percival Zhang YH, Himmel ME, Mielenz JR. Outlook for cellulase improvement: screening and selection strategies. Biotechnol Adv. 2006;24:452–481. - PubMed
-
- Kumar R, Singh S, Singh OV. Bioconversion of lignocellulosic biomass: biochemical and molecular perspectives. J Ind Microbiol Biotechnol. 2008;35:377–391. - PubMed
-
- Reese ET, Levinsons HS, Downing M. Quartermaster culture collection. Farlowia. 1950;4:45–86.
Publication types
MeSH terms
Substances
Associated data
- Actions
- Actions
- Actions
- Actions
- Actions
- Actions
- Actions
- Actions
- Actions
- Actions
- Actions
- Actions
- Actions
- Actions
- Actions
- Actions
- Actions
- Actions
- Actions
- Actions
- Actions
- Actions
- Actions
- Actions
- Actions
- Actions
- Actions
- Actions
- Actions
- Actions
- Actions
- Actions
- Actions
- Actions
- Actions
- Actions
- Actions
- Actions
- Actions
- Actions
- Actions
- Actions
- Actions
- Actions
- Actions
- Actions
- Actions
- Actions
- Actions
- Actions
- Actions
- Actions
- Actions
- Actions
- Actions
- Actions
- Actions
- Actions
- Actions
- Actions
- Actions
- Actions
- Actions
- Actions
- Actions
- Actions
- Actions
- Actions
- Actions
- Actions
- Actions
- Actions
- Actions
- Actions
- Actions
- Actions
- Actions
- Actions
- Actions
- Actions
- Actions
- Actions
- Actions
- Actions
- Actions
- Actions
- Actions
- Actions
- Actions
- Actions
- Actions
- Actions
- Actions
- Actions
- Actions
- Actions
- Actions
- Actions
LinkOut - more resources
Full Text Sources
Other Literature Sources

