. 2010 Apr 19;23(4):821-35.
doi: 10.1021/tx900446r.

Lipid peroxyl radicals mediate tyrosine dimerization and nitration in membranes

Affiliations

Lipid peroxyl radicals mediate tyrosine dimerization and nitration in membranes

Silvina Bartesaghi et al. Chem Res Toxicol. .

Abstract

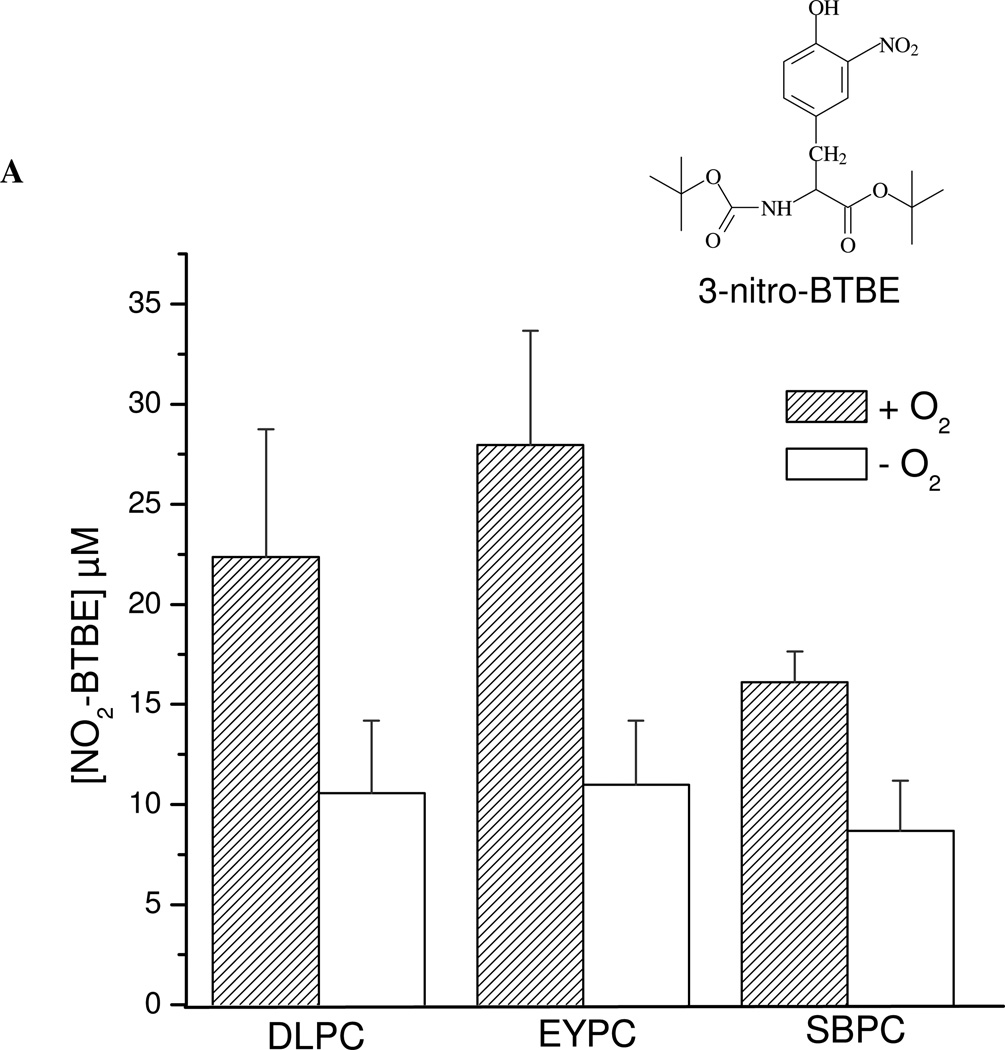
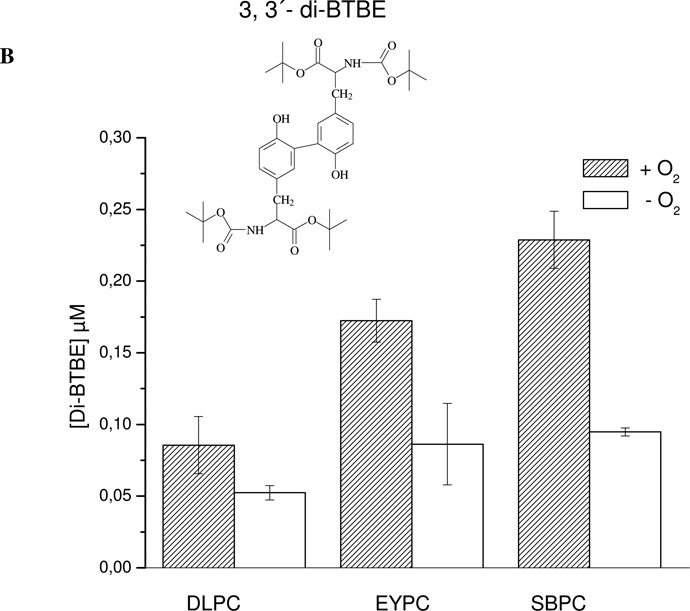
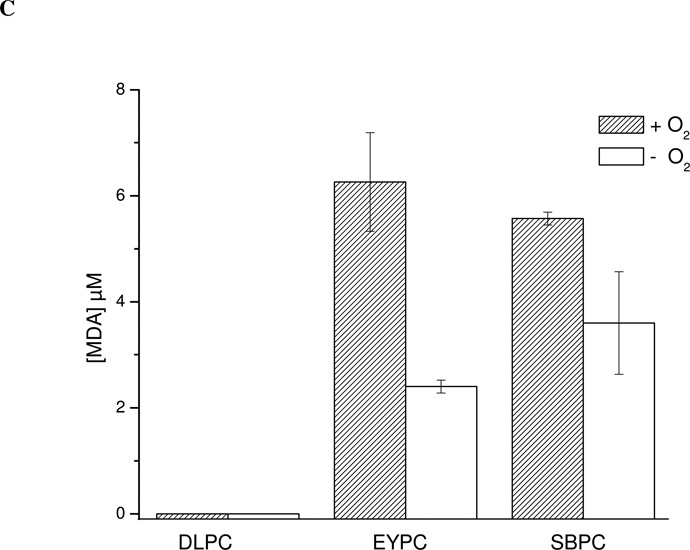
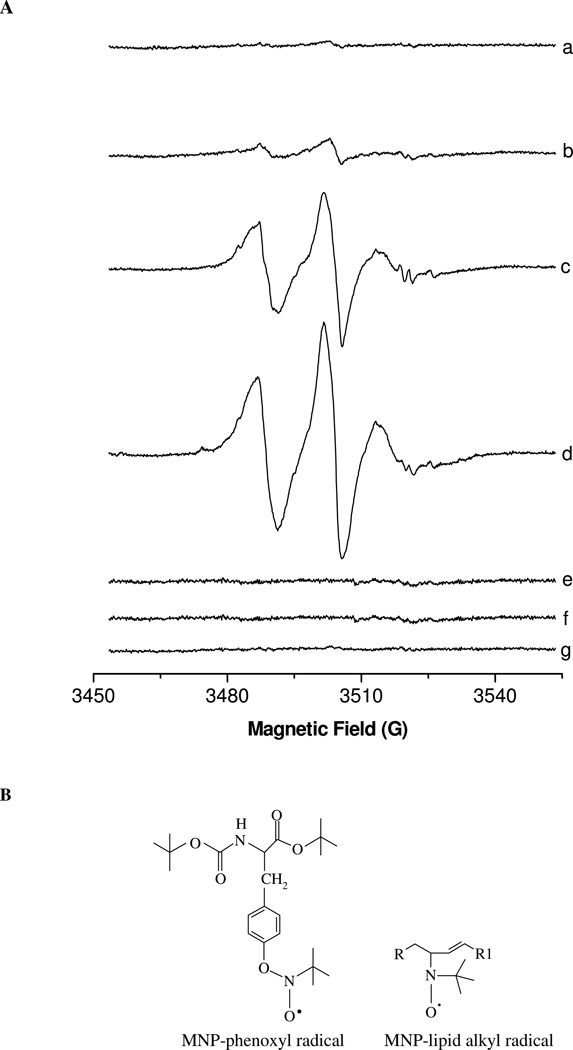
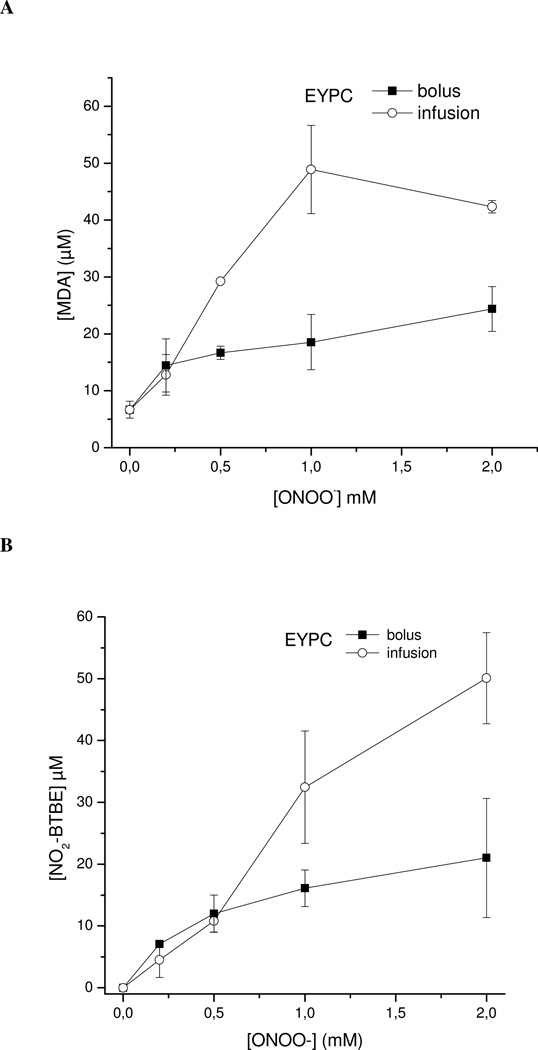
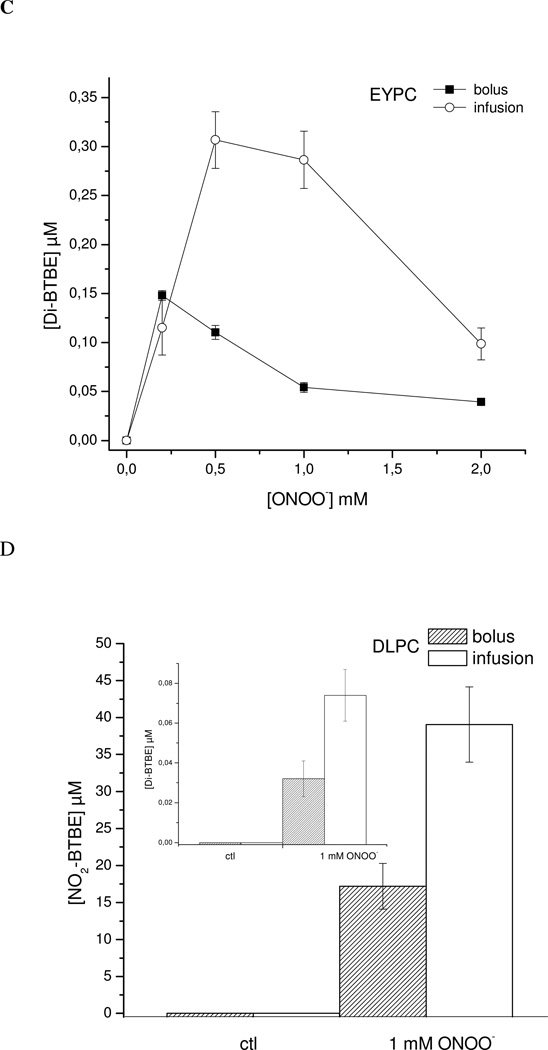
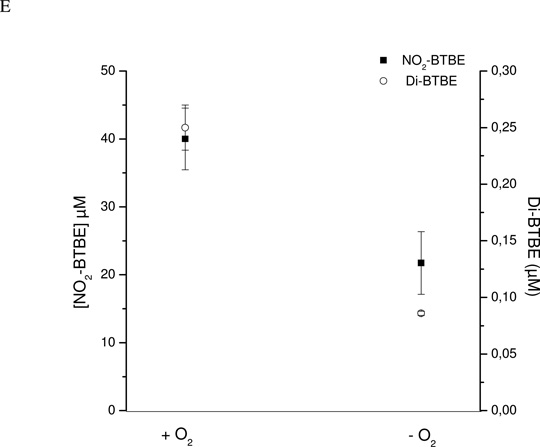
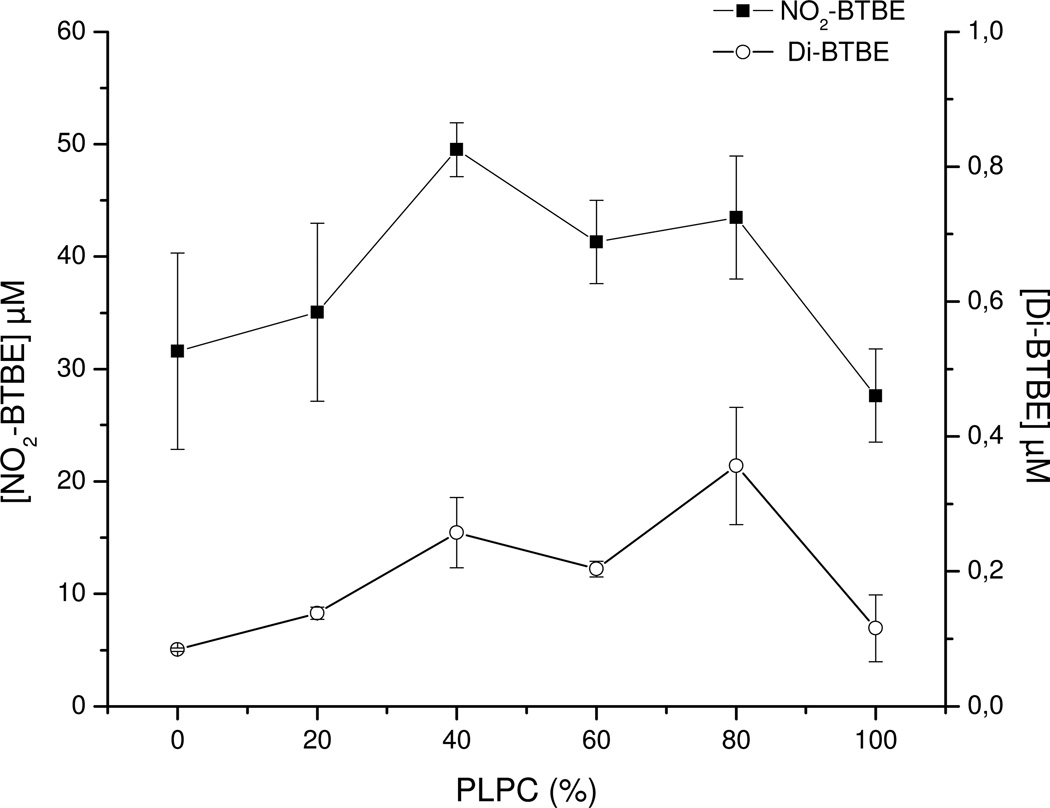
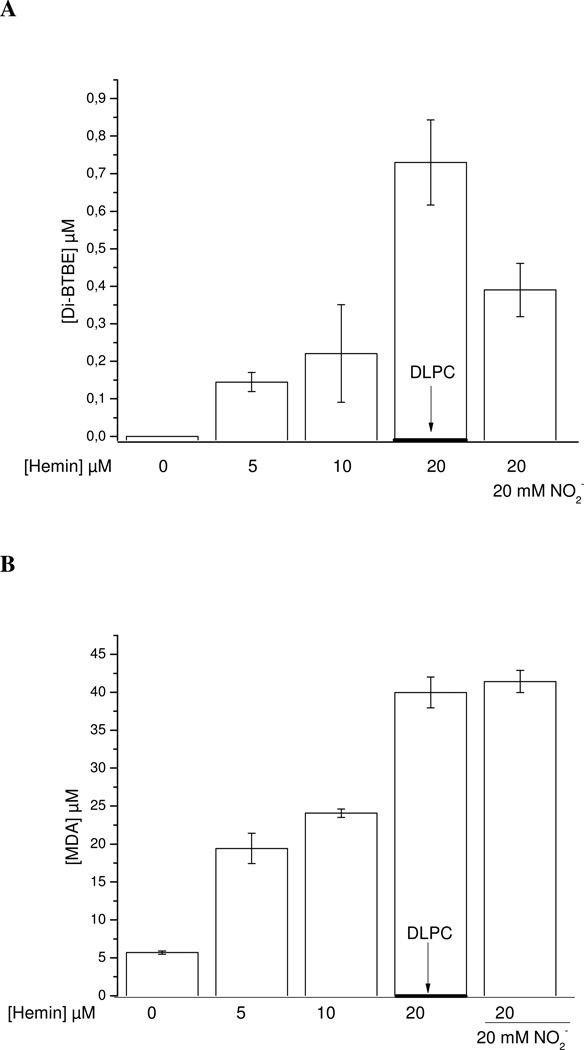
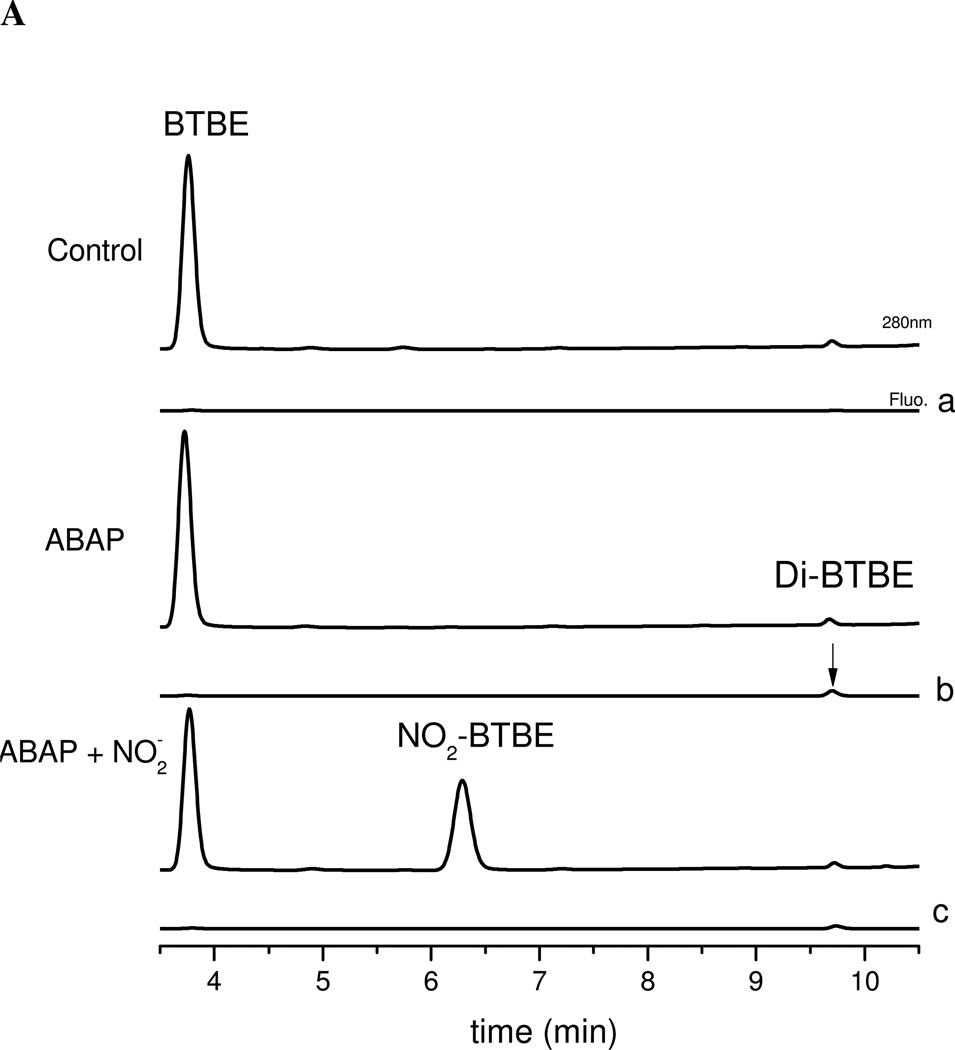
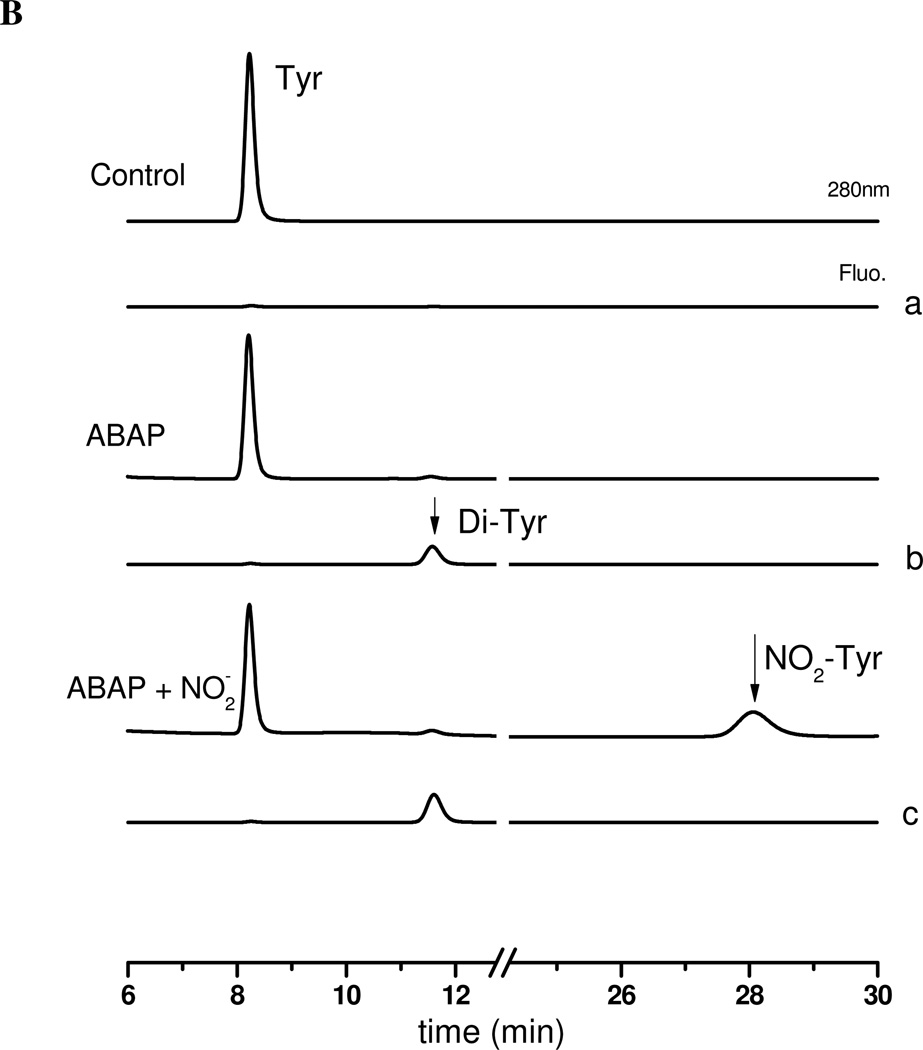
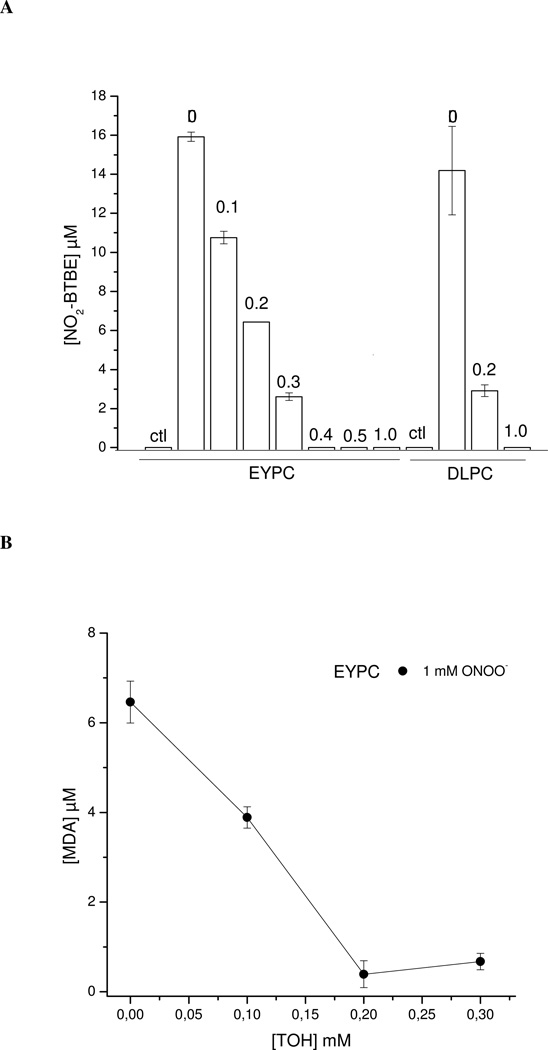
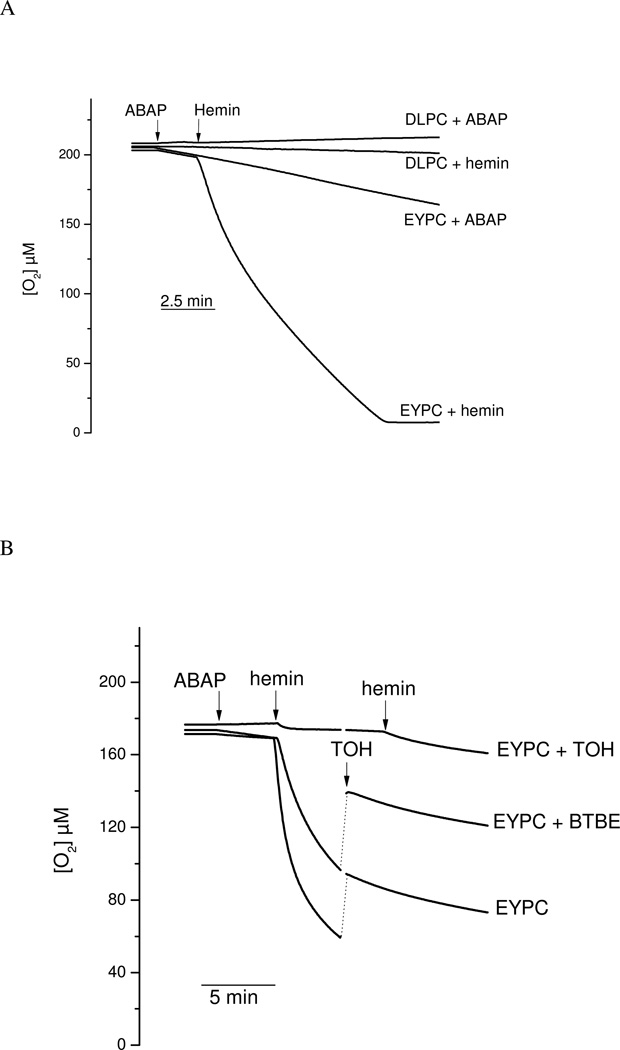
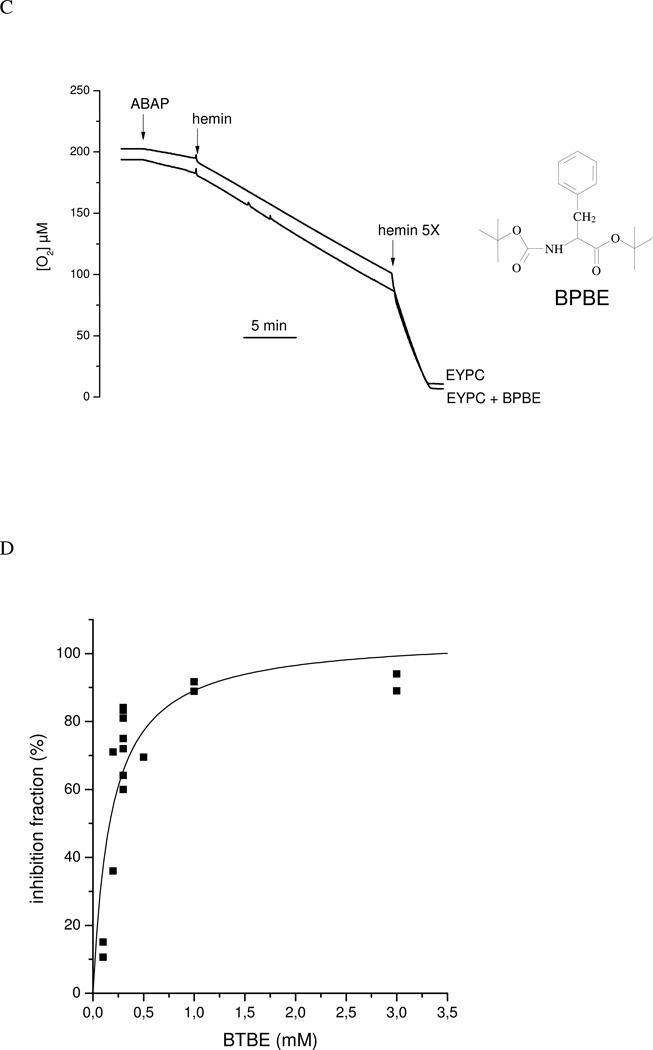
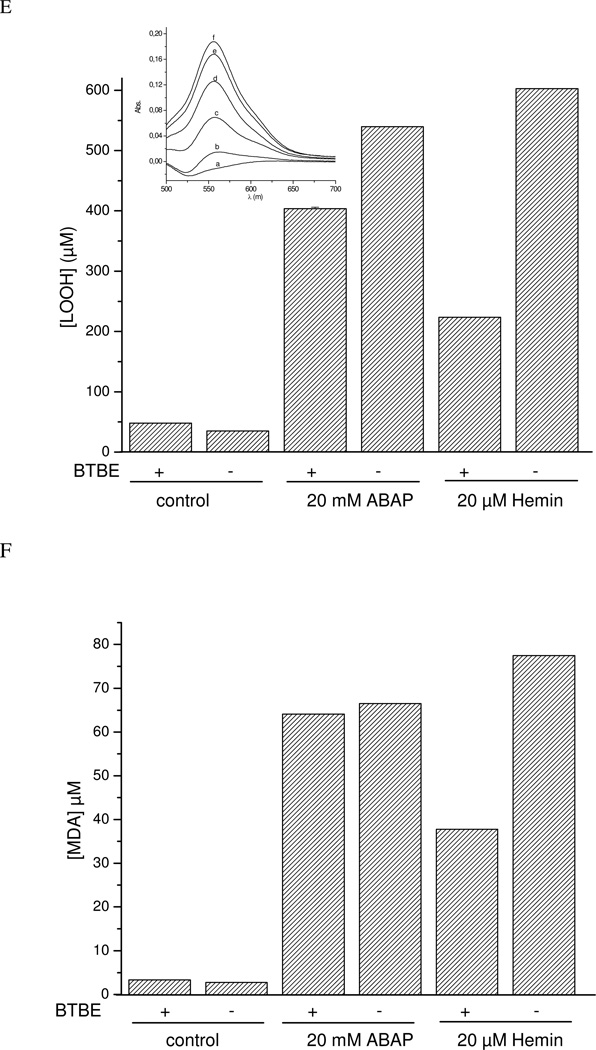
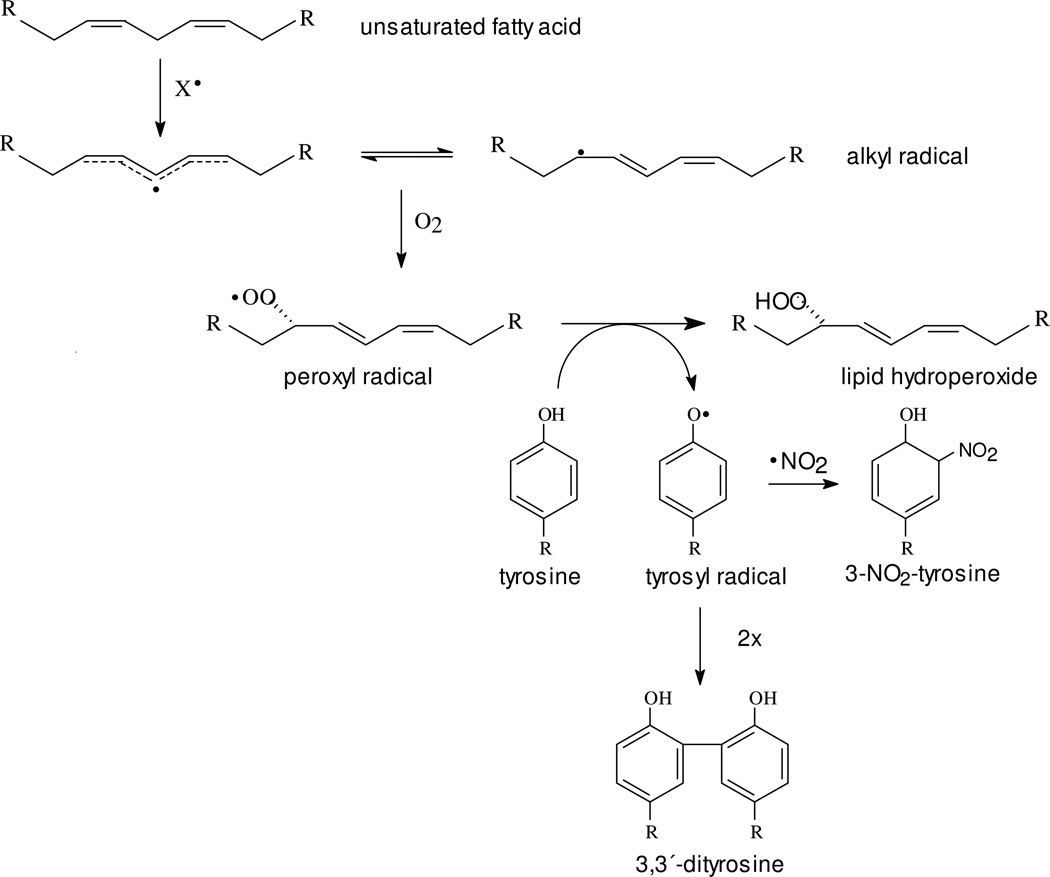
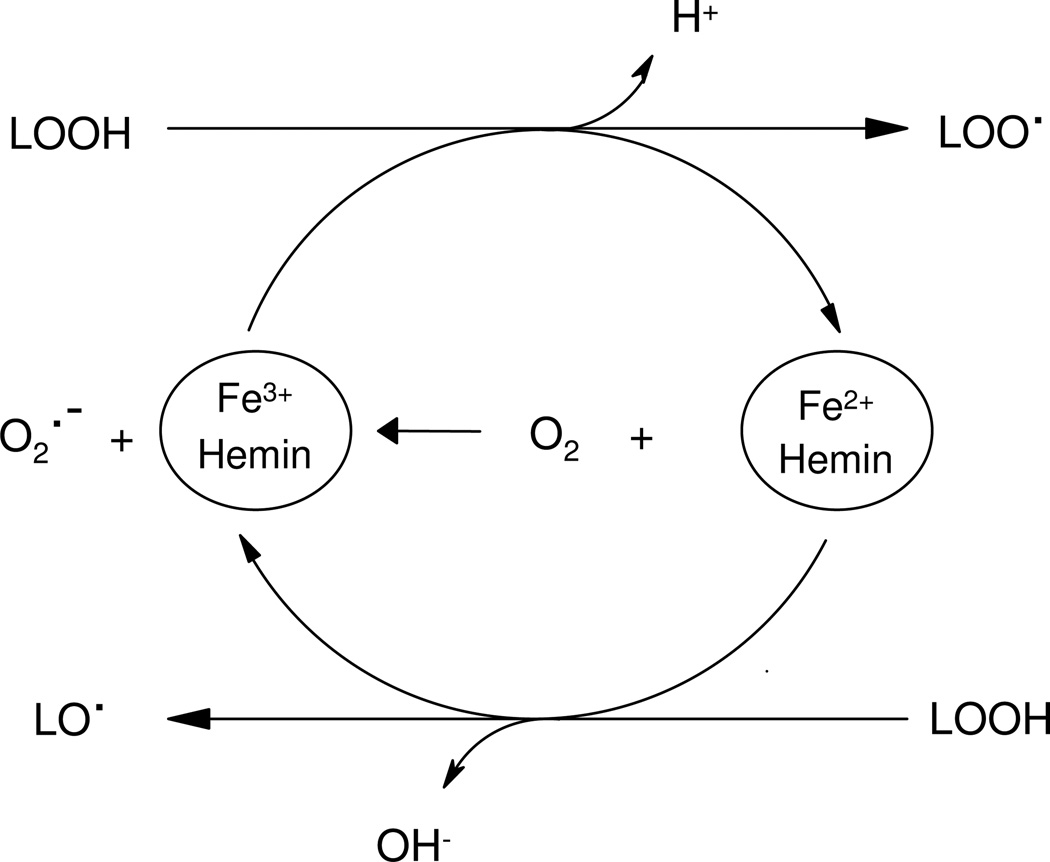
Protein tyrosine dimerization and nitration by biologically relevant oxidants usually depend on the intermediate formation of tyrosyl radical ((*)Tyr). In the case of tyrosine oxidation in proteins associated with hydrophobic biocompartments, the participation of unsaturated fatty acids in the process must be considered since they typically constitute preferential targets for the initial oxidative attack. Thus, we postulate that lipid-derived radicals mediate the one-electron oxidation of tyrosine to (*)Tyr, which can afterward react with another (*)Tyr or with nitrogen dioxide ((*)NO(2)) to yield 3,3'-dityrosine or 3-nitrotyrosine within the hydrophobic structure, respectively. To test this hypothesis, we have studied tyrosine oxidation in saturated and unsaturated fatty acid-containing phosphatidylcholine (PC) liposomes with an incorporated hydrophobic tyrosine analogue BTBE (N-t-BOC l-tyrosine tert-butyl ester) and its relationship with lipid peroxidation promoted by three oxidation systems, namely, peroxynitrite, hemin, and 2,2'-azobis (2-amidinopropane) hydrochloride. In all cases, significant tyrosine (BTBE) oxidation was seen in unsaturated PC liposomes, in a way that was largely decreased at low oxygen concentrations. Tyrosine oxidation levels paralleled those of lipid peroxidation (i.e., malondialdehyde and lipid hydroperoxides), lipid-derived radicals and BTBE phenoxyl radicals were simultaneously detected by electron spin resonance spin trapping, supporting an association between the two processes. Indeed, alpha-tocopherol, a known reactant with lipid peroxyl radicals (LOO(*)), inhibited both tyrosine oxidation and lipid peroxidation induced by all three oxidation systems. Moreover, oxidant-stimulated liposomal oxygen consumption was dose dependently inhibited by BTBE but not by its phenylalanine analogue, BPBE (N-t-BOC l-phenylalanine tert-butyl ester), providing direct evidence for the reaction between LOO(*) and the phenol moiety in BTBE, with an estimated second-order rate constant of 4.8 x 10(3) M(-1) s(-1). In summary, the data presented herein demonstrate that LOO(*) mediates tyrosine oxidation processes in hydrophobic biocompartments and provide a new mechanistic insight to understand protein oxidation and nitration in lipoproteins and biomembranes.


Figures

Figure 1
Figure 1. Effect of oxygen on peroxynitrite-dependent BTBE oxidation
BTBE (0.3 mM) was incorporated to the different liposomes, DLPC, EYPC and SBPC (30 mM) and exposed to peroxynitrite (1 mM) in the presence of oxygen (200 µM) or under low oxygen tensions (~ 5 µM). Samples were analyzed for (A) 3-nitro-BTBE, (B) 3,3´-di-BTBE and (C) MDA content. Basal MDA levels in EYPC, SBPC and DLPC were 4.88 ±1,09; 4.97 ±0.72 and 0, respectively. Structures of 3-NO2- N-t-BOC L-tyrosine tert butyl ester (3-nitro-BTBE) and 3,3´-di N-t-BOC L-tyrosine tert butyl ester (3,3´-di-BTBE) are indicated in the corresponding panels.
Figure 2
Figure 2. Electron spin resonance- spin trapping of BTBE phenoxyl and lipid peroxyl radical
(A) Reaction mixtures consisting on BTBE (2.5 mM) incorporated into 45 mM DLPC liposomes in phosphate buffer 100 mM (pH 7.4) containing dtpa (0.1 mM) were treated with 20 mM 2-methyl-2-nitrosopropane (MNP) spin trap and rapidly mixed with 5 mM peroxynitrite. Samples were subsequently transferred to a 50-µl capillary tube for EPR measurements. (a) DLPC liposomes plus peroxynitrite; (b) BTBE-containing DLPC liposomes plus peroxynitrite; (c) EYPC liposomes plus peroxynitrite; (d) BTBE-containing EYPC liposomes plus peroxynitrite; (e) Same as B with reverse order addition of peroxynitrite (f) Same as D with reverse order addition of peroxynitrite; (g) Peroxynitrite only. (B) The structures of the MNP-phenoxyl and MNP-lipid alkyl radical adducts are shown and correspond to the signals obtained in lines b and c of panel A, respectively. Both spin adducts are present in line d.
Figure 3
Figure 3. Peroxynitrite-mediated oxidations: slow infusion versus bolus addition
BTBE (0.3 mM) was incorporated to EYPC and DLPC liposomes (30 mM) and exposed to peroxynitrite either as a single bolus (■) or by slow infusion (○) in order to achieve final concentrations of (0.2–2 mM). Samples were analyzed for 3-nitro-BTBE, 3,3´-di-BTBE and MDA content. EYPC: (A) MDA (B) 3-nitro-BTBE (C) 3,3´-di-BTBE; DLPC: (D) 3-nitro-BTBE and 3,3´-di-BTBE (inset); (E) BTBE (0.3 mM) containing liposomes were exposed to slow infusion of peroxynitrite (1 mM) in the presence and absence of oxygen and 3-nitro-BTBE and 3,3´-di-BTBE was measured as previously.
Figure 4
Figure 4. Lipid unsaturation degree and BTBE oxidation
BTBE nitration (■) and dimerization (○) were studied as a function of fatty acid unsaturation by using mixtures of DLPC and PLPC (0–100% PLPC) liposomes containing 0.3 mM of BTBE and treated with peroxynitrite (1 mM).
Figure 5
Figure 5. Hemin-induced lipid peroxidation and BTBE oxidation
BTBE (0.3 mM)-containing DLPC and EYPC liposomes (30 mM) were exposed to hemin (5–20 µM) in sodium phosphate 100 mM pH 7.3 plus 0.1 mM DTPA. Samples were analyzed for (A) 3,3´-di-BTBE and (B) MDA content. The arrow indicates the values corresponding to DLPC liposomes which were zero for both measurements under all reaction conditions.
Figure 6
Figure 6. ABAP-induced BTBE and tyrosine oxidation
Panel A: (a) BTBE (0.3 mM)-containing DLPC liposomes in sodium phosphate100 mM (pH 7.3) plus 0.1 mM DTPA were exposed to (b) ABAP (20 mM) in the absence and (c) presence of nitrite (40 mM) and 3-nitro-BTBE and 3,3´-di-BTBE were measured. Panel B: (a) Tyrosine (0.3 mM) in sodium phosphate 100 mM (pH 7.3) plus 0.1 mM DTPA was exposed to (b) ABAP (20 mM) in the absence and (c) presence of nitrite (40 mM) and 3-nitrotyrosine and 3,3´-dityrosine were measured.
Figure 7
Figure 7. Effect of α-tocopherol on lipid peroxidation and BTBE oxidation
The indicated concentrations of α-tocopherol (0.1–1 mM) were pre-incorporated to different EYPC and DLPC preparations (30 mM) and treated with peroxynitrite (1 mM); Samples were analyzed for (A) 3-nitro-BTBE and (B) MDA content.
Figure 8
Figure 8. Oxygen consumption studies
Oxygen consumption was measured in a 2K Oxygraph to assess ABAP (10 mM) and hemin (1 µM)-induced lipid peroxidation in in sodium phosphate 100 mM (pH 7.3) plus 0.1 mM DTPA. (A) EYPC and DLPC liposomes (6.25 mM). (B) BTBE (0.3 mM), or α-tocopherol (0.3 mM) containing EYPC liposomes. The arrow indicates the exogenous addition of 0.25 mM of α-tocopherol; the transient increase in oxygen levels observed in this record is due to to oxygen dissolved in the volume of reagent added (C) BPBE (0.3mM) and control EYPC liposomes. (D) EYPC liposomes in the absence and presence of different concentrations of BTBE (0.1 –3 mM) were exposed to ABAP (10 mM) and hemin (1 µM) and oxygen consumption inhibition was evaluated as a function of BTBE concentration. (E) EYPC liposomes with or without BTBE (0.3 mM) were exposed to hemin (30 min) and ABAP (2.5 h) and lipid hydroperoxide content was measured: Inset: UV-Vis spectra of same samples shown in E (a) − BTBE; (b) + BTBE; (c) + BTBE + hemin; (d) + BTBE + ABAP; (e) − BTBE + ABAP; (f) − BTBE + hemin. (F): Same samples as (E) in which MDA content was measured. The structure of N-t-BOC L-phenylalanine tert butyl ester (BPBE) is indicated in the corresponding panel.
Figure 9
Figure 9. Proposed reaction mechanism by which lipid peroxyl radicals participate in tyrosine oxidation
Scheme 1
Scheme 1. Lipid hydroperoxide reactions with hemin and lipid-derived radicals formation
Lipid hydroperoxide (LOOH) can react with hemin either in Fe3+ or Fe2+ redox states to yield LOO• or LO•, respectively. Secondarily, hemin in the reduced state (Fe2+) can yield O2.- that can further participate in redox reactions.

References

    1. Bodaness RS, Leclair M, Zigler JS., Jr An analysis of the H2O2-mediated crosslinking of lens crystallins catalyzed by the heme-undecapeptide from cytochrome c. Arch Biochem Biophys. 1984;231:461–469. - PubMed
    1. Giulivi C, Traaseth NJ, Davies KJ. Tyrosine oxidation products: analysis and biological relevance. Amino Acids. 2003;25:227–232. - PubMed
    1. Heinecke JW. Tyrosyl radical production by myeloperoxidase: a phagocyte pathway for lipid peroxidation and dityrosine cross-linking of proteins. Toxicology. 2002;177:11–22. - PubMed
    1. Hsiai TK, Hwang J, Barr ML, Correa A, Hamilton R, Alavi M, Rouhanizadeh M, Cadenas E, Hazen SL. Hemodynamics influences vascular peroxynitrite formation: Implication for low-density lipoprotein apo-B-100 nitration. Free Radic Biol Med. 2007;42:519–529. - PMC - PubMed
    1. Radi R. Nitric oxide, oxidants, and protein tyrosine nitration. Proc Natl Acad Sci U S A. 2004;101:4003–4008. - PMC - PubMed

Publication types