

Structural alphabets derived from attractors in conformational space
- PMID: 20170534
- PMCID: PMC2838871
- DOI: 10.1186/1471-2105-11-97
Structural alphabets derived from attractors in conformational space
Abstract
Background: The hierarchical and partially redundant nature of protein structures justifies the definition of frequently occurring conformations of short fragments as 'states'. Collections of selected representatives for these states define Structural Alphabets, describing the most typical local conformations within protein structures. These alphabets form a bridge between the string-oriented methods of sequence analysis and the coordinate-oriented methods of protein structure analysis.
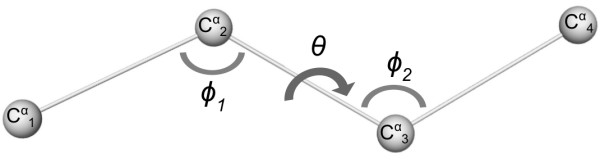
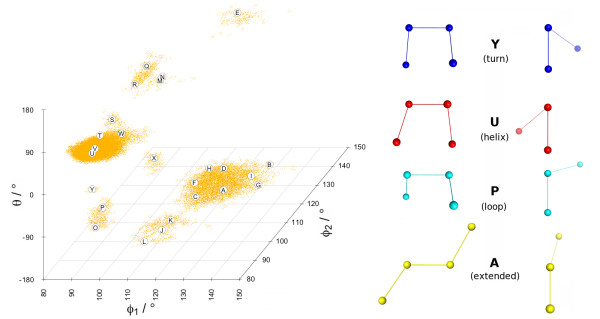
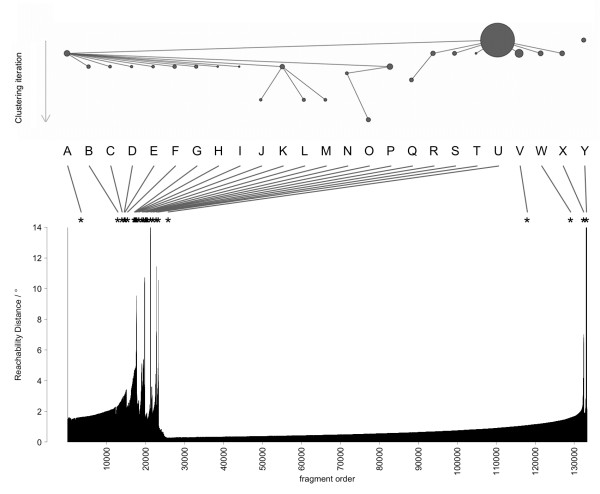
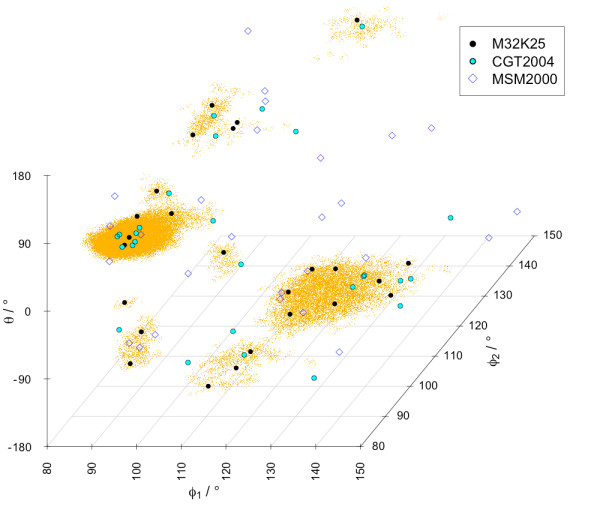
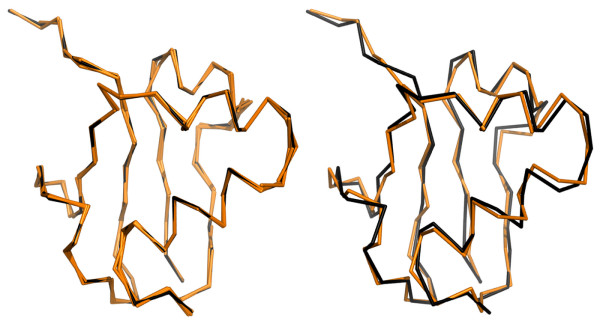
Results: A Structural Alphabet has been derived by clustering all four-residue fragments of a high-resolution subset of the protein data bank and extracting the high-density states as representative conformational states. Each fragment is uniquely defined by a set of three independent angles corresponding to its degrees of freedom, capturing in simple and intuitive terms the properties of the conformational space. The fragments of the Structural Alphabet are equivalent to the conformational attractors and therefore yield a most informative encoding of proteins. Proteins can be reconstructed within the experimental uncertainty in structure determination and ensembles of structures can be encoded with accuracy and robustness.
Conclusions: The density-based Structural Alphabet provides a novel tool to describe local conformations and it is specifically suitable for application in studies of protein dynamics.
Figures


Similar articles
-
Automated alphabet reduction for protein datasets.BMC Bioinformatics. 2009 Jan 6;10:6. doi: 10.1186/1471-2105-10-6. BMC Bioinformatics. 2009. PMID: 19126227 Free PMC article.
-
Correlation between local structural dynamics of proteins inferred from NMR ensembles and evolutionary dynamics of homologues of known structure.J Biomol Struct Dyn. 2014;32(5):751-8. doi: 10.1080/07391102.2013.789989. Epub 2013 Jun 3. J Biomol Struct Dyn. 2014. PMID: 23730714
-
Reduced amino acid alphabets exhibit an improved sensitivity and selectivity in fold assignment.Bioinformatics. 2009 Jun 1;25(11):1356-62. doi: 10.1093/bioinformatics/btp164. Epub 2009 Apr 7. Bioinformatics. 2009. PMID: 19351620 Free PMC article.
-
Determination of conformationally heterogeneous states of proteins.Curr Opin Struct Biol. 2007 Feb;17(1):15-20. doi: 10.1016/j.sbi.2007.01.002. Epub 2007 Jan 18. Curr Opin Struct Biol. 2007. PMID: 17239581 Review.
-
[A turning point in the knowledge of the structure-function-activity relations of elastin].J Soc Biol. 2001;195(2):181-93. J Soc Biol. 2001. PMID: 11727705 Review. French.
Cited by
-
Cholesterol binding to the sterol-sensing region of Niemann Pick C1 protein confines dynamics of its N-terminal domain.PLoS Comput Biol. 2020 Oct 6;16(10):e1007554. doi: 10.1371/journal.pcbi.1007554. eCollection 2020 Oct. PLoS Comput Biol. 2020. PMID: 33021976 Free PMC article.
-
Behavioral Data Analysis of Robot-Assisted Autism Spectrum Disorder (ASD) Interventions Based on Lattice Computing Techniques.Sensors (Basel). 2022 Jan 14;22(2):621. doi: 10.3390/s22020621. Sensors (Basel). 2022. PMID: 35062582 Free PMC article.
-
Allosteric Priming of E. coli CheY by the Flagellar Motor Protein FliM.Biophys J. 2020 Sep 15;119(6):1108-1122. doi: 10.1016/j.bpj.2020.08.009. Epub 2020 Aug 15. Biophys J. 2020. PMID: 32891187 Free PMC article.
-
Development of a TSR-Based Method for Protein 3-D Structural Comparison With Its Applications to Protein Classification and Motif Discovery.Front Chem. 2021 Jan 13;8:602291. doi: 10.3389/fchem.2020.602291. eCollection 2020. Front Chem. 2021. PMID: 33520934 Free PMC article.
-
Dynamics of Dystrophin's Actin-Binding Domain.Biophys J. 2018 Aug 7;115(3):445-454. doi: 10.1016/j.bpj.2018.05.039. Epub 2018 Jun 20. Biophys J. 2018. PMID: 30007583 Free PMC article.
References
Publication types
MeSH terms
Substances
LinkOut - more resources
Full Text Sources
