

Rat brain endothelial cells are a target of manganese toxicity
- PMID: 20170646
- PMCID: PMC2849855
- DOI: 10.1016/j.brainres.2010.02.016
Rat brain endothelial cells are a target of manganese toxicity
Abstract
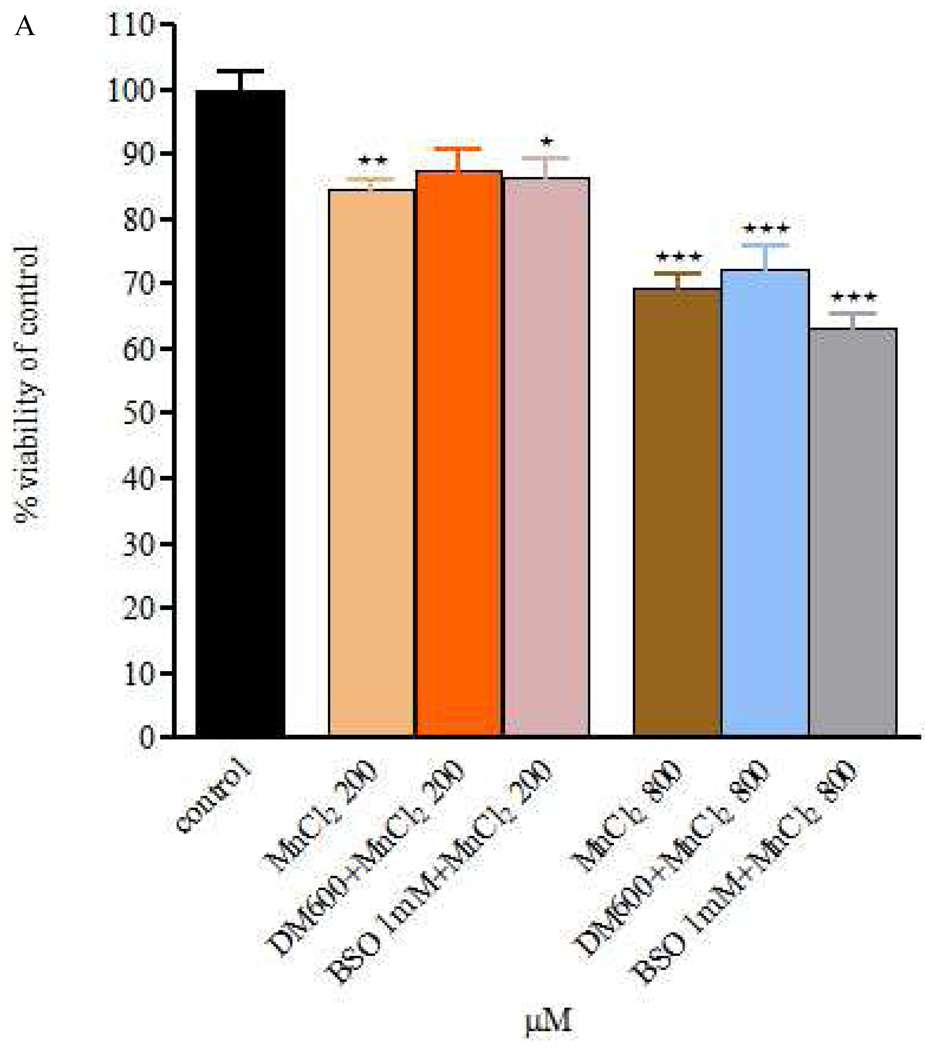
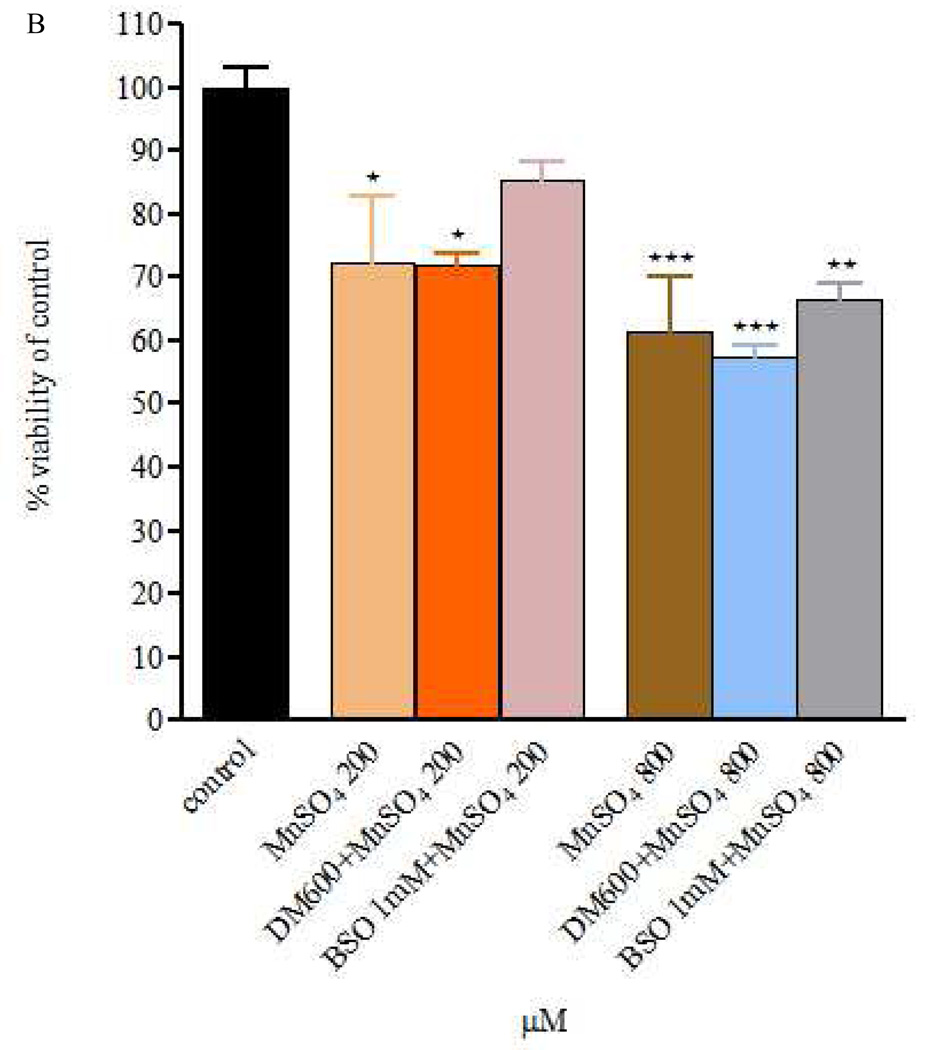
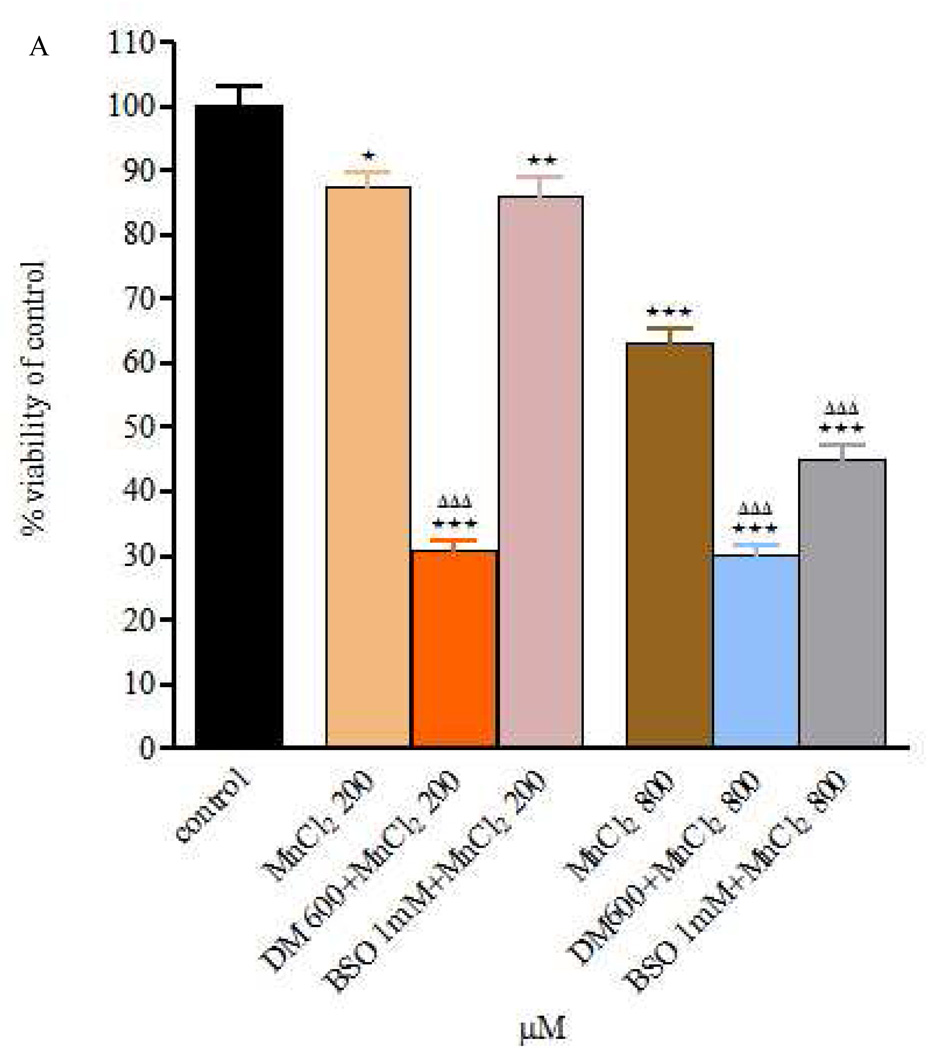
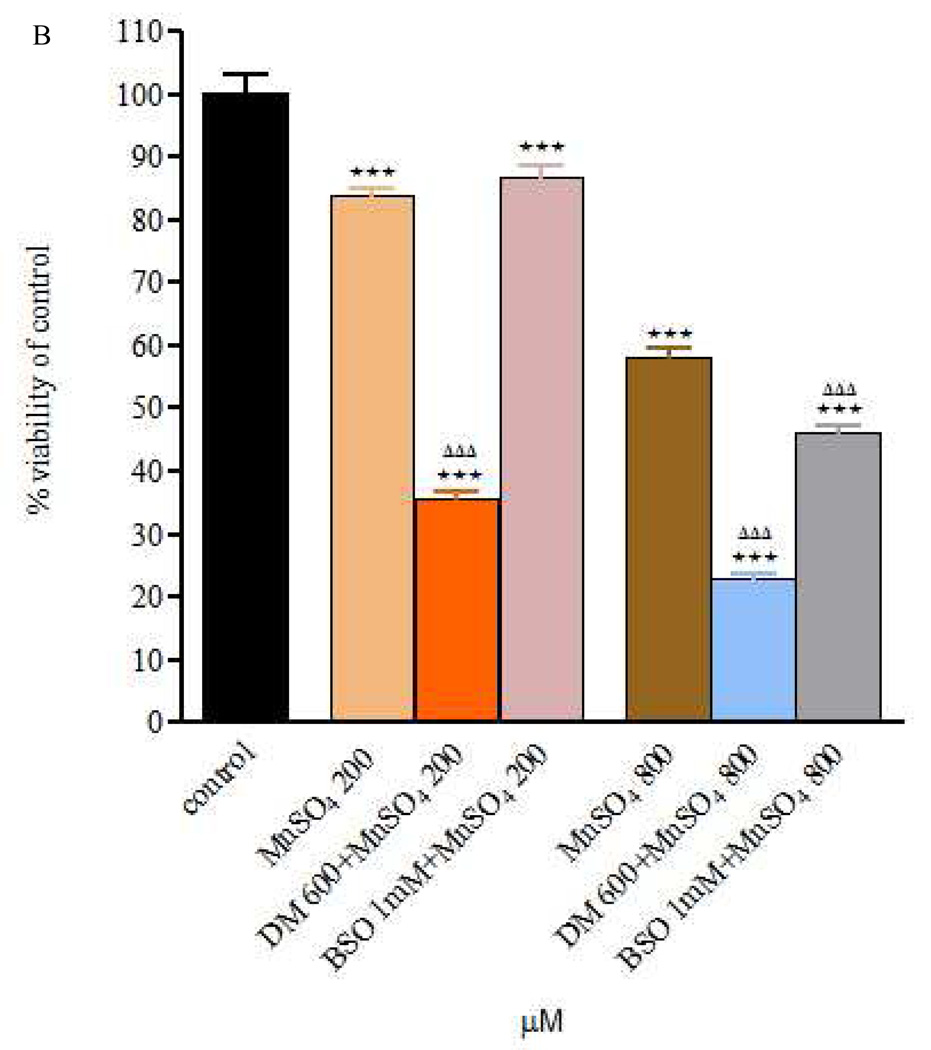
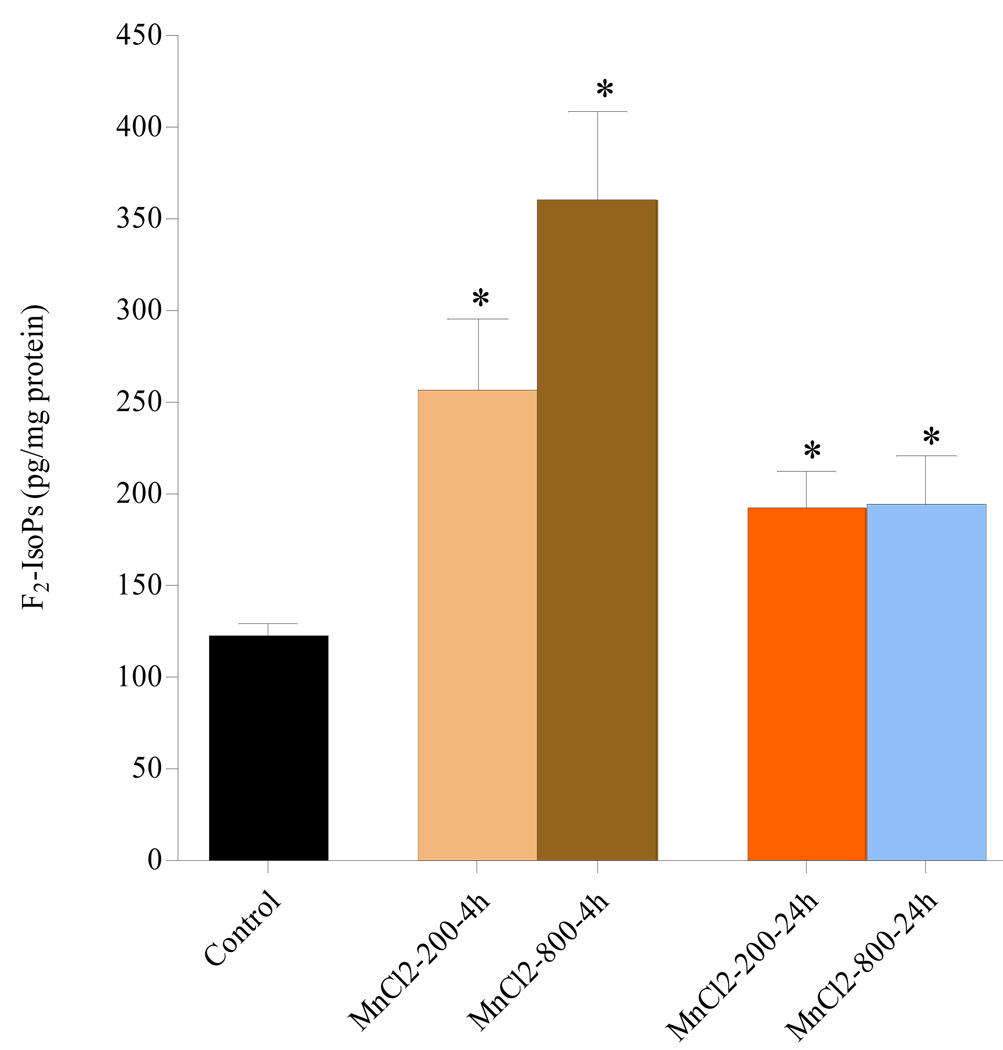
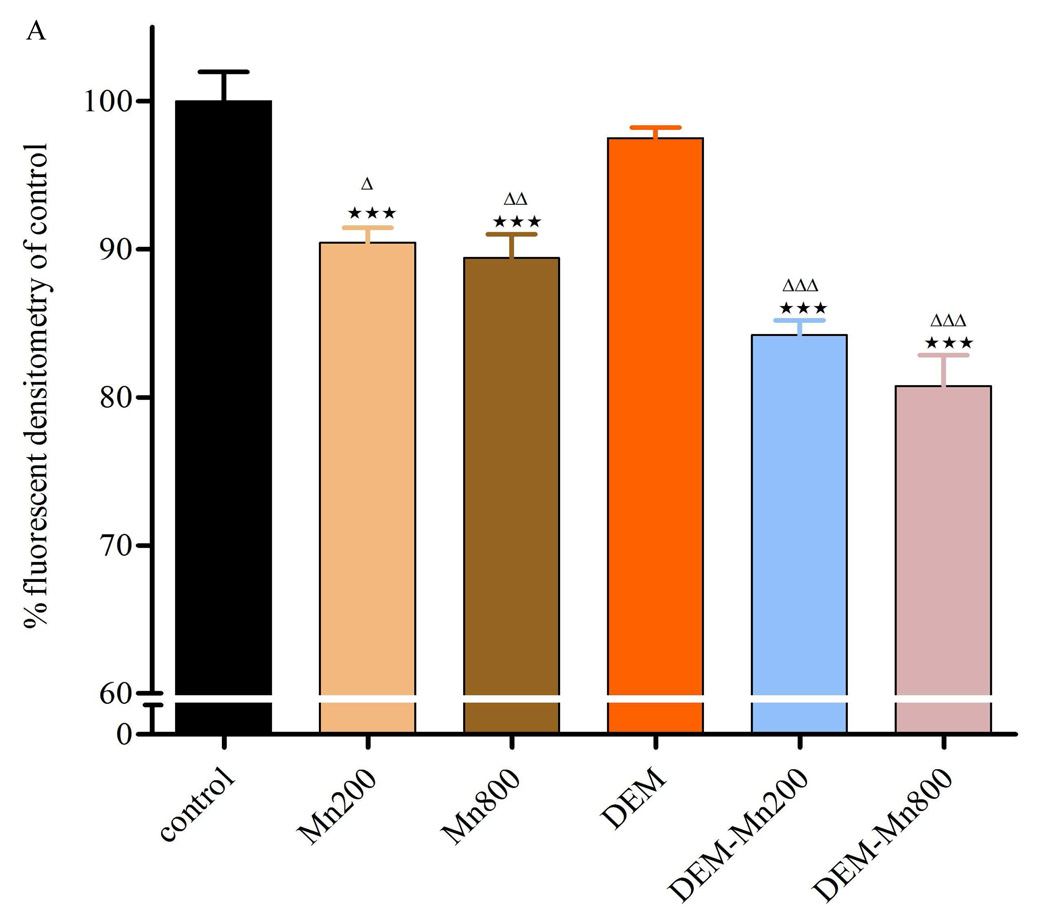
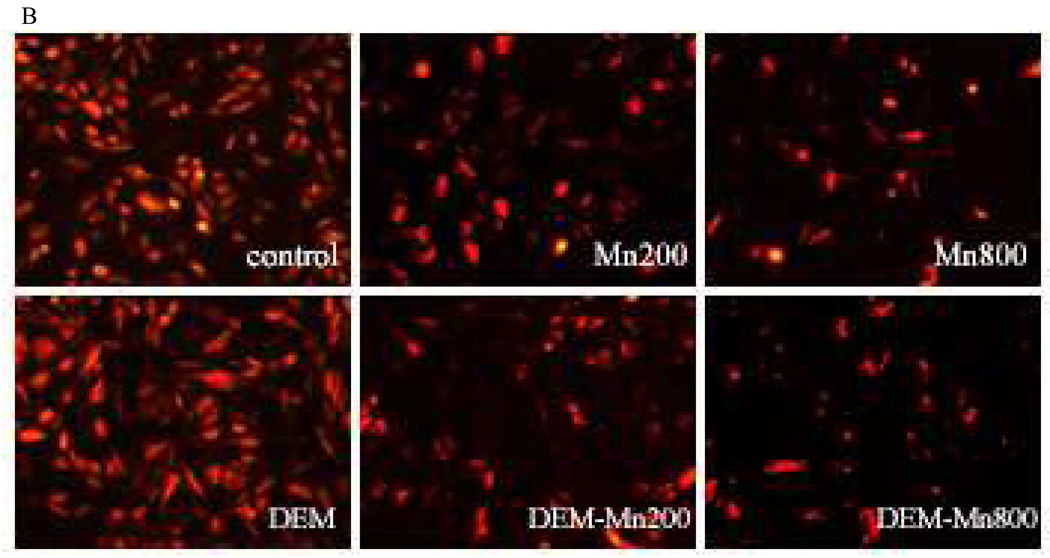
Manganese (Mn) is an essential trace metal; however, exposure to high Mn levels can result in neurodegenerative changes resembling Parkinson's disease (PD). Information on Mn's effects on endothelial cells of the blood-brain barrier (BBB) is lacking. Accordingly, we tested the hypothesis that BBB endothelial cells are a primary target for Mn-induced neurotoxicity. The studies were conducted in an in vitro BBB model of immortalized rat brain endothelial (RBE4) cells. ROS production was determined by F(2)-isoprostane (F(2)-IsoPs) measurement. The relationship between Mn toxicity and redox status was investigated upon intracellular glutathione (GSH) depletion with diethylmaleate (DEM) or L-buthionine sulfoximine (BSO). Mn exposure (200 or 800 microM MnCl(2) or MnSO(4)) for 4 or 24h led to significant decrease in cell viability vs. controls. DEM or BSO pre-treatment led to further enhancement in cytotoxicity vs. exposure to Mn alone, with more pronounced cell death after 24-h DEM pre-treatment. F(2)-IsoPs levels in cells exposed to MnCl(2) (200 or 800 microM) were significantly increased after 4h and remained elevated 24h after exposure compared with controls. Consistent with the effects on cell viability and F(2)-IsoPs, treatment with MnCl(2) (200 or 800 microM) was also associated with a significant decrease in membrane potential. This effect was more pronounced in cells exposed to DEM plus MnCl(2) vs. cells exposed to Mn alone. We conclude that Mn induces direct injury to mitochondria in RBE4 cells. The ensuing impairment in energy metabolism and redox status may modify the restrictive properties of the BBB compromising its function.
Copyright 2010 Elsevier B.V. All rights reserved.
Figures
Similar articles
-
Up-regulation of P-glycoprotein expression by glutathione depletion-induced oxidative stress in rat brain microvessel endothelial cells.J Neurochem. 2006 Sep;98(5):1465-73. doi: 10.1111/j.1471-4159.2006.03993.x. J Neurochem. 2006. PMID: 16923159
-
Antioxidants prevent the cytotoxicity of manganese in RBE4 cells.Brain Res. 2008 Oct 21;1236:200-5. doi: 10.1016/j.brainres.2008.07.125. Epub 2008 Aug 12. Brain Res. 2008. PMID: 18725210
-
Metallothionein induction attenuates the effects of glutathione depletors in rat hepatocytes.Toxicol Sci. 1999 Jun;49(2):297-305. doi: 10.1093/toxsci/49.2.297. Toxicol Sci. 1999. PMID: 10416275
-
Manganese flux across the blood-brain barrier.Neuromolecular Med. 2009;11(4):297-310. doi: 10.1007/s12017-009-8101-2. Epub 2009 Nov 10. Neuromolecular Med. 2009. PMID: 19902387 Review.
-
Redox dynamics of manganese as a mitochondrial life-death switch.Biochem Biophys Res Commun. 2017 Jan 15;482(3):388-398. doi: 10.1016/j.bbrc.2016.10.126. Epub 2017 Feb 3. Biochem Biophys Res Commun. 2017. PMID: 28212723 Free PMC article. Review.
Cited by
-
Prolactin is a peripheral marker of manganese neurotoxicity.Brain Res. 2011 Mar 25;1382:282-90. doi: 10.1016/j.brainres.2011.01.047. Epub 2011 Jan 22. Brain Res. 2011. PMID: 21262206 Free PMC article.
-
Effect of chronic glutathione deficiency on the behavioral phenotype of Gclm-/- knockout mice.Neurotoxicol Teratol. 2012 Jul;34(4):450-7. doi: 10.1016/j.ntt.2012.04.009. Epub 2012 May 10. Neurotoxicol Teratol. 2012. PMID: 22580179 Free PMC article.
-
D-Ribose-L-Cysteine Improves Glutathione Levels, Neuronal and Mitochondrial Ultrastructural Damage, Caspase-3 and GFAP Expressions Following Manganese-Induced Neurotoxicity.Neurotox Res. 2021 Dec;39(6):1846-1858. doi: 10.1007/s12640-021-00404-3. Epub 2021 Sep 4. Neurotox Res. 2021. PMID: 34480735
-
The impact of manganese on neurotransmitter systems.J Trace Elem Med Biol. 2020 Sep;61:126554. doi: 10.1016/j.jtemb.2020.126554. Epub 2020 May 20. J Trace Elem Med Biol. 2020. PMID: 32480053 Free PMC article. Review.
-
Manganese Is Essential for Neuronal Health.Annu Rev Nutr. 2015;35:71-108. doi: 10.1146/annurev-nutr-071714-034419. Epub 2015 May 13. Annu Rev Nutr. 2015. PMID: 25974698 Free PMC article. Review.
References
-
- Abbott PJ. Methylcyclopentadienyl manganese tricarbonyl (MMT) in petrol: the toxicological issues. Sci. Total Environ. 1987;67:247–255. - PubMed
-
- Abbott NJ, Couraud PO, Roux F. Studies on an immortalized brain endothelial cell line: characterization permeability and transport. In: Greenwood J, Begley DJ, Segal MB, editors. New concepts of a blood-brain barrier. New York: Plenum Press; 1995. pp. 239–249.
-
- Ali SF, Duhart HM, Newport GD, Lipe GW, Slikker W. Manganese-induced reactive oxygen species: comparison between Mn+2 and Mn+3. Neurodegeneration. 1995;4(3):329–334. - PubMed
-
- Aschner M, Gannon M. Manganese (Mn) transport across the rat blood-brain barrier: Saturable and transferring-dependent transport mechanisms. Brain Res. Bull. 1994;33:345–349. - PubMed
-
- Aschner M, Vrana KE, Zheng W. Manganese uptake and distribution in the central nervous system (CNS) Neurotoxicology. 1999;20:173–180. - PubMed
Publication types
MeSH terms
Substances
Grants and funding
LinkOut - more resources
Full Text Sources
