Review
. 2010 Sep;64(1):14-103.
doi: 10.1016/j.brainresrev.2010.02.002. Epub 2010 Feb 17.

Distinct patterns of neuronal inputs and outputs of the juxtaparaventricular and suprafornical regions of the lateral hypothalamic area in the male rat

Affiliations
Review

Distinct patterns of neuronal inputs and outputs of the juxtaparaventricular and suprafornical regions of the lateral hypothalamic area in the male rat

Joel D Hahn et al. Brain Res Rev. 2010 Sep.

Abstract

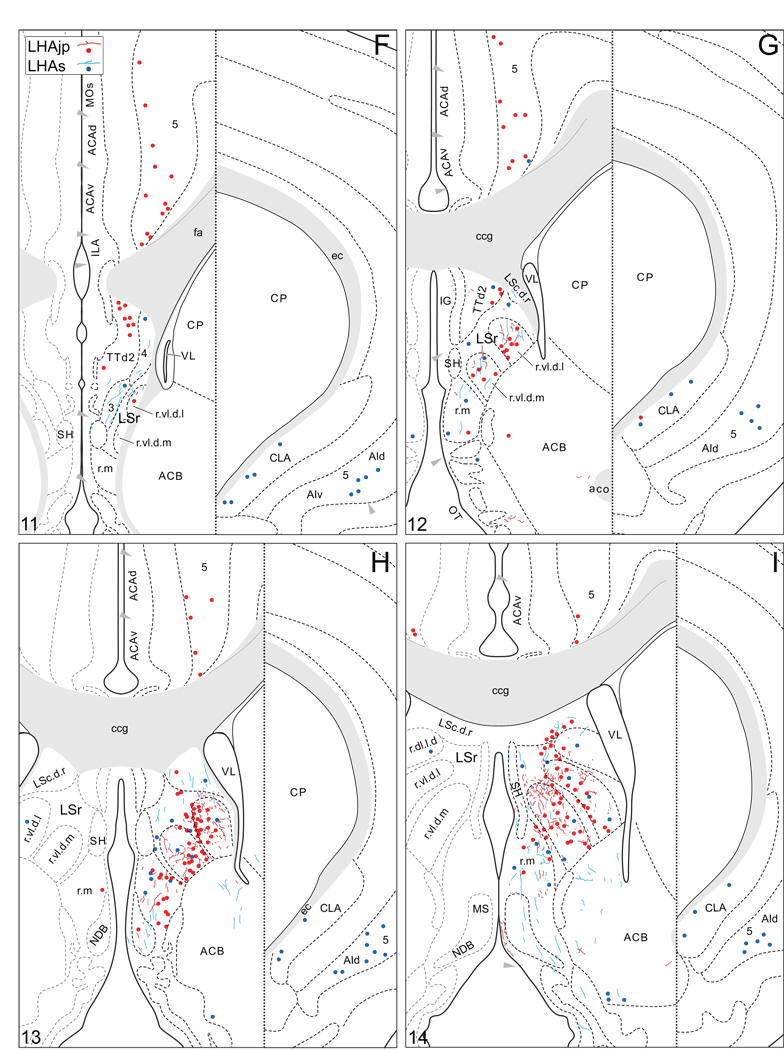
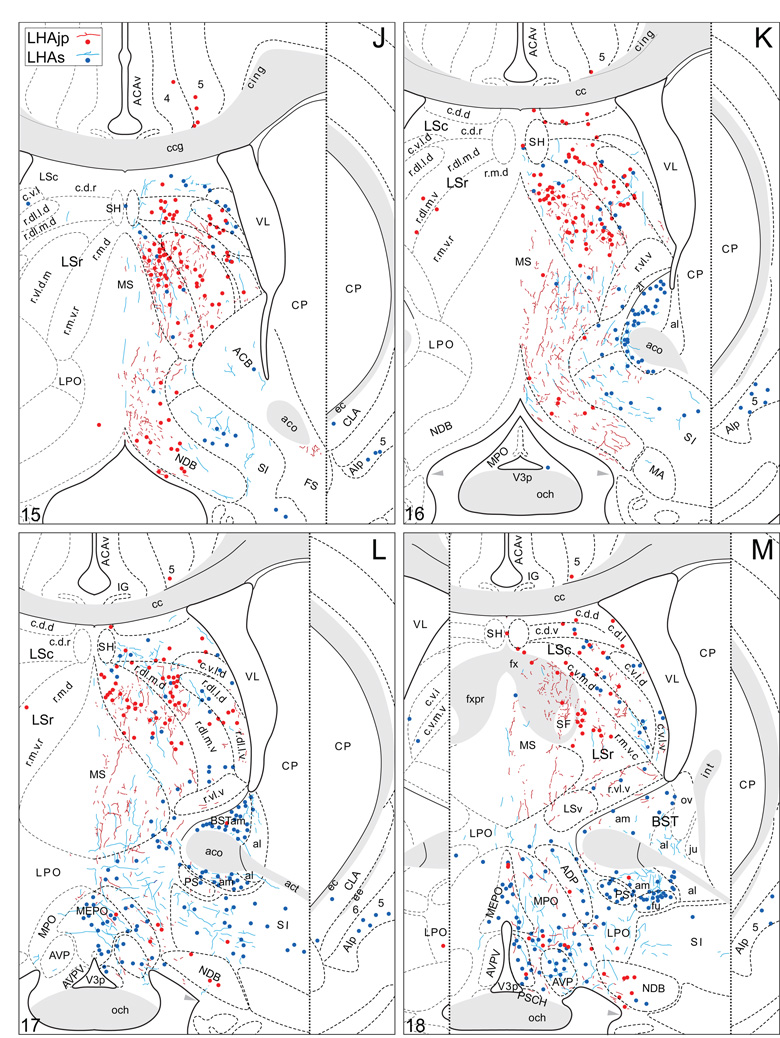
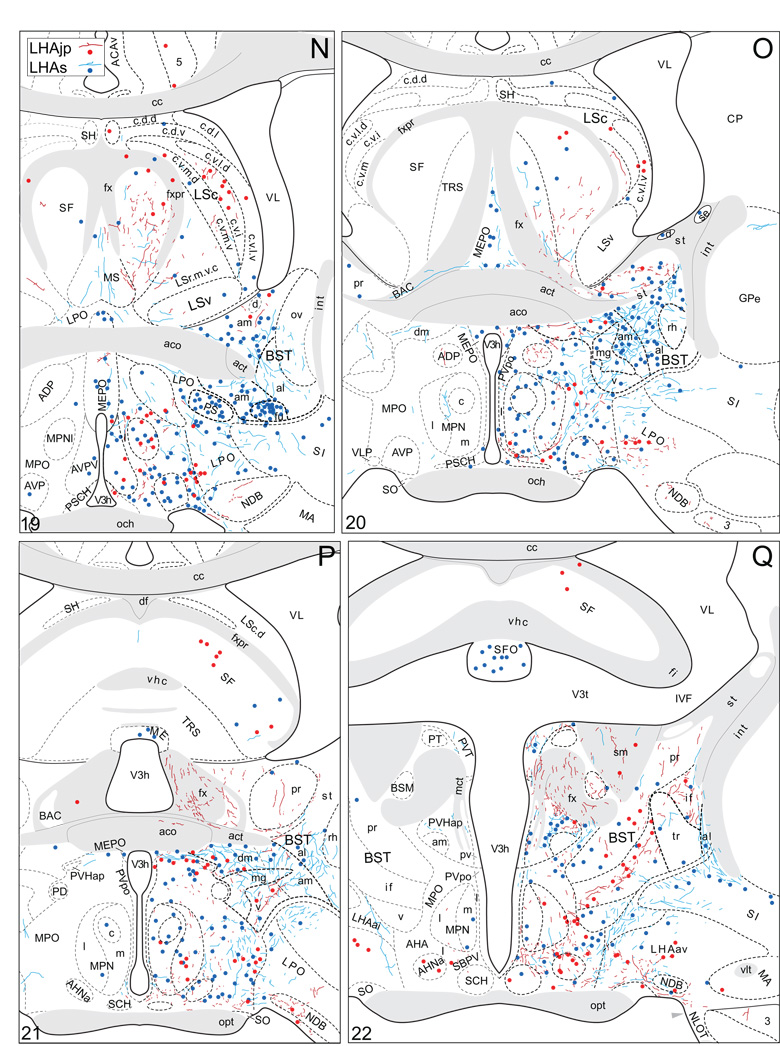
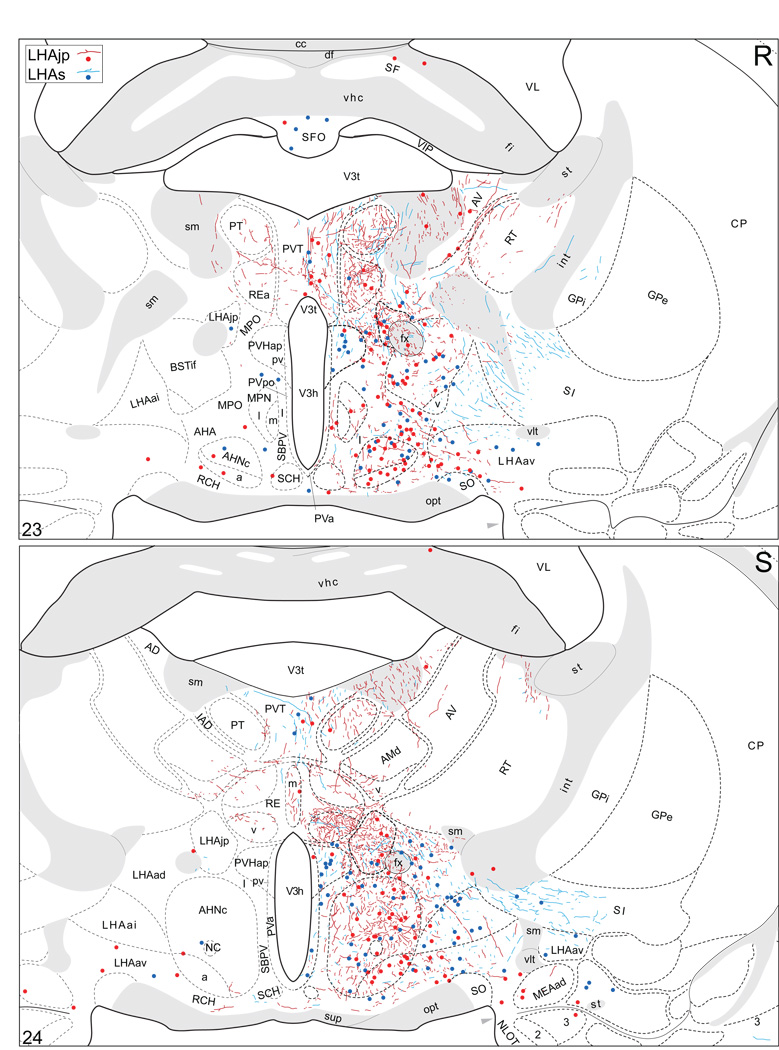
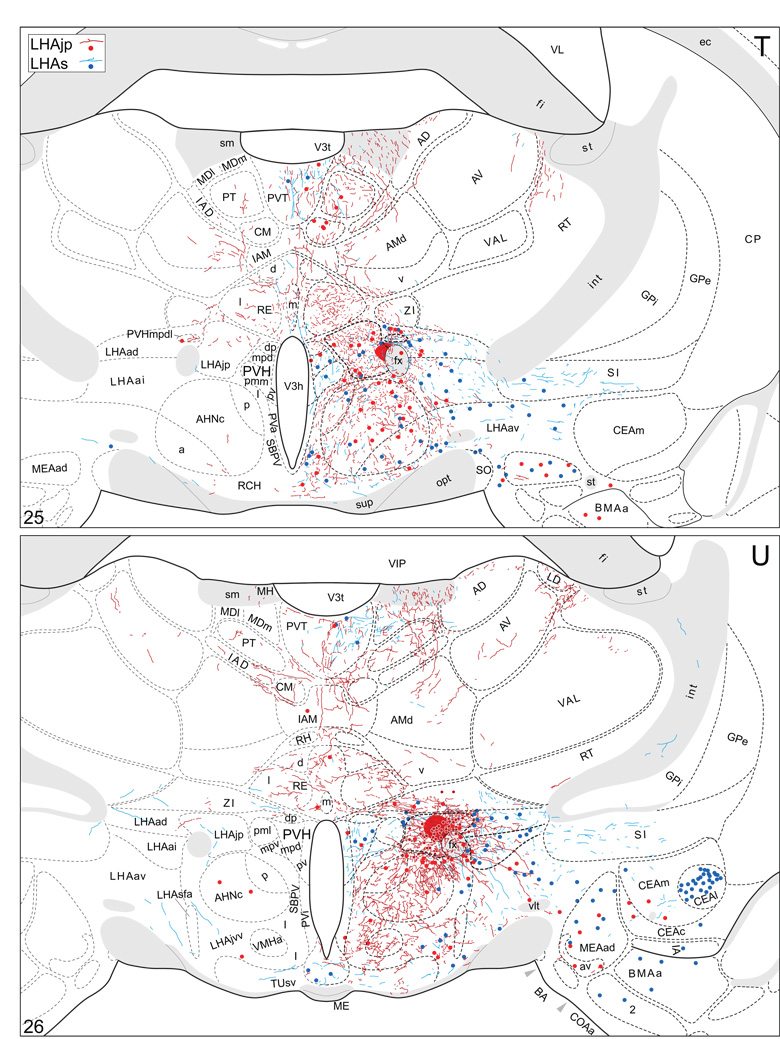
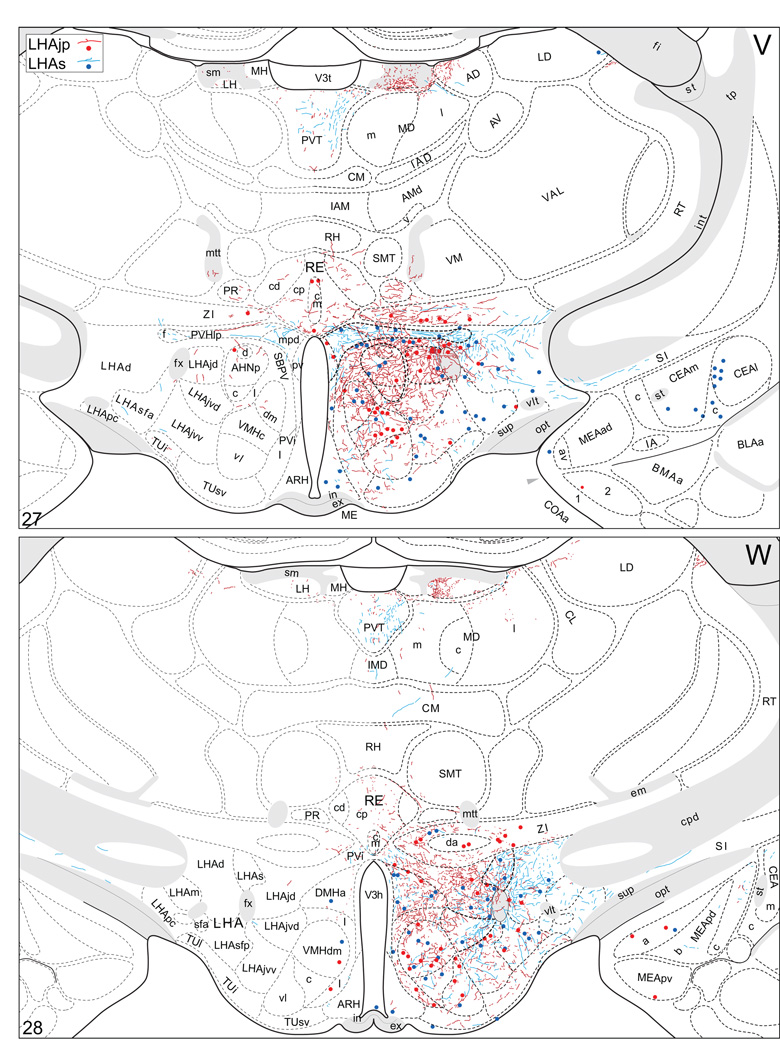
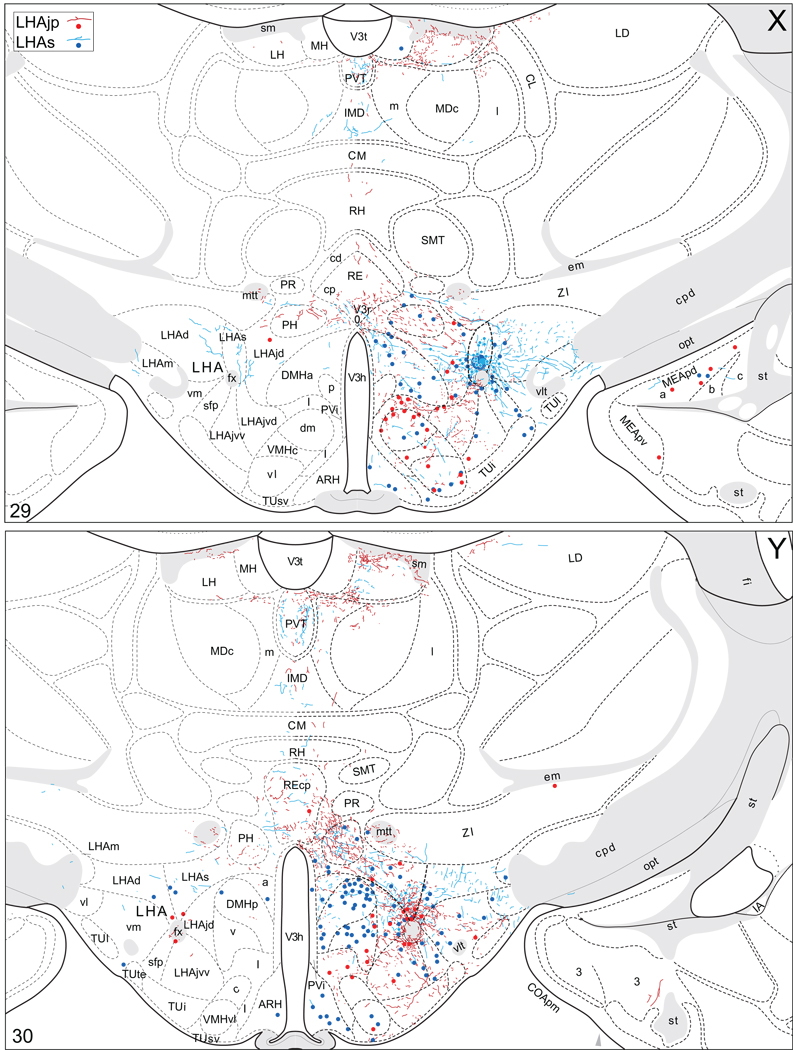
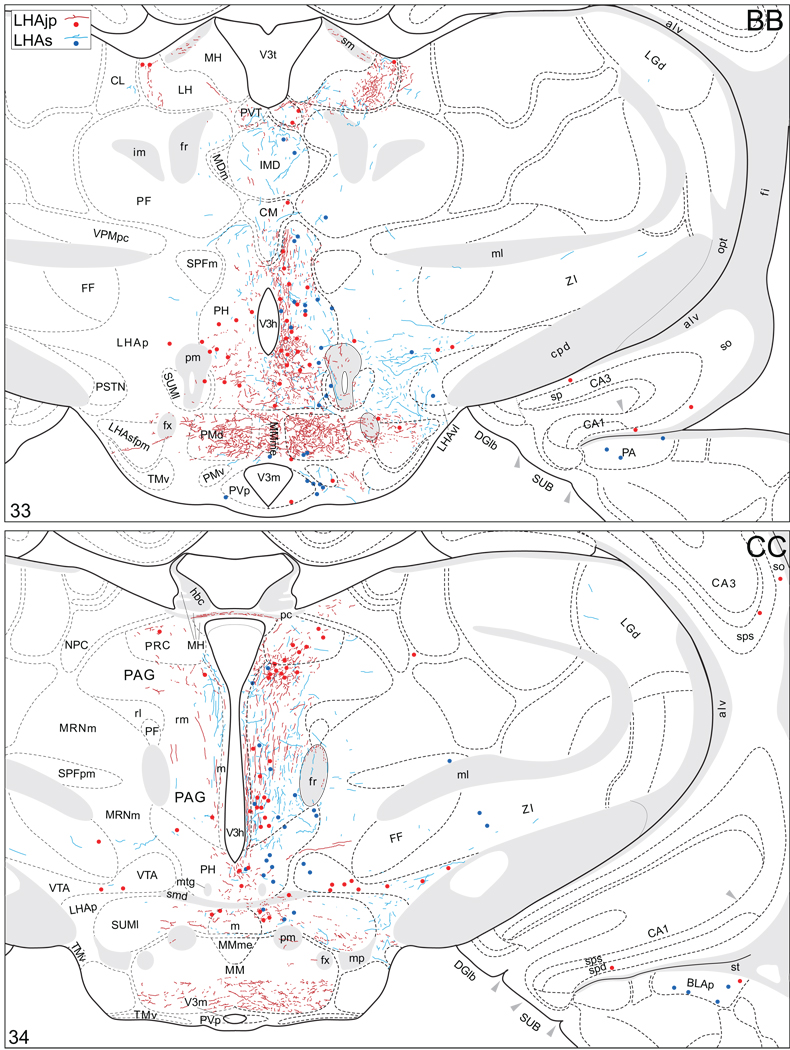
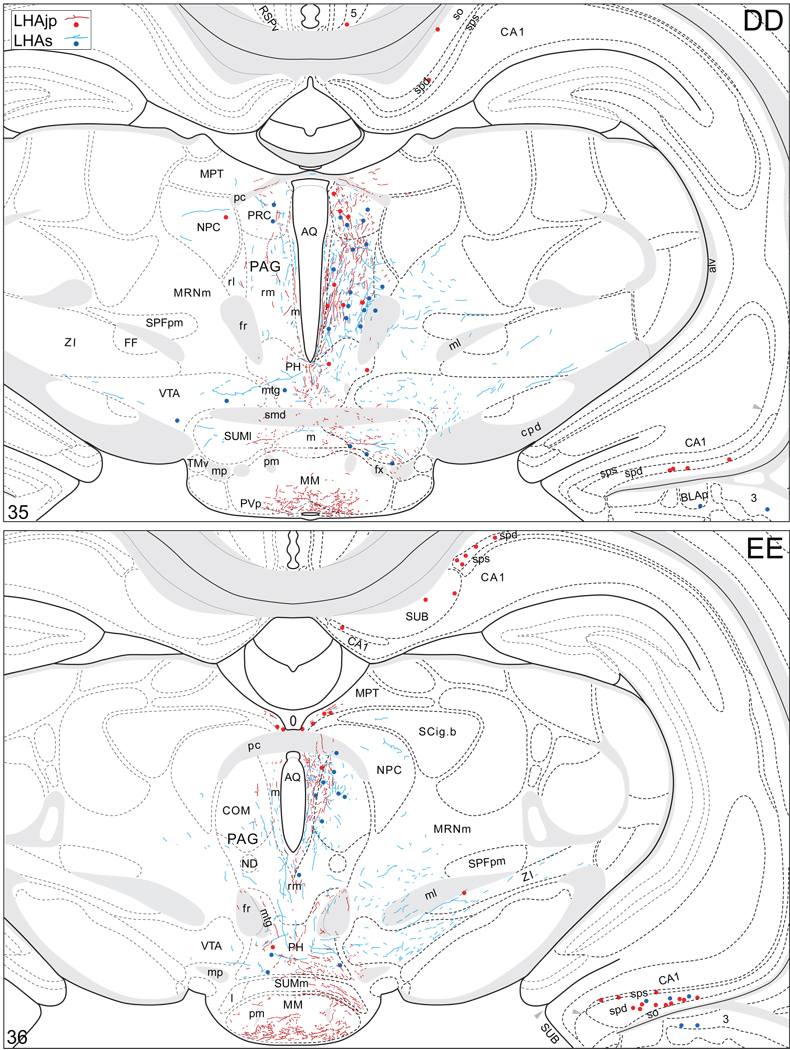
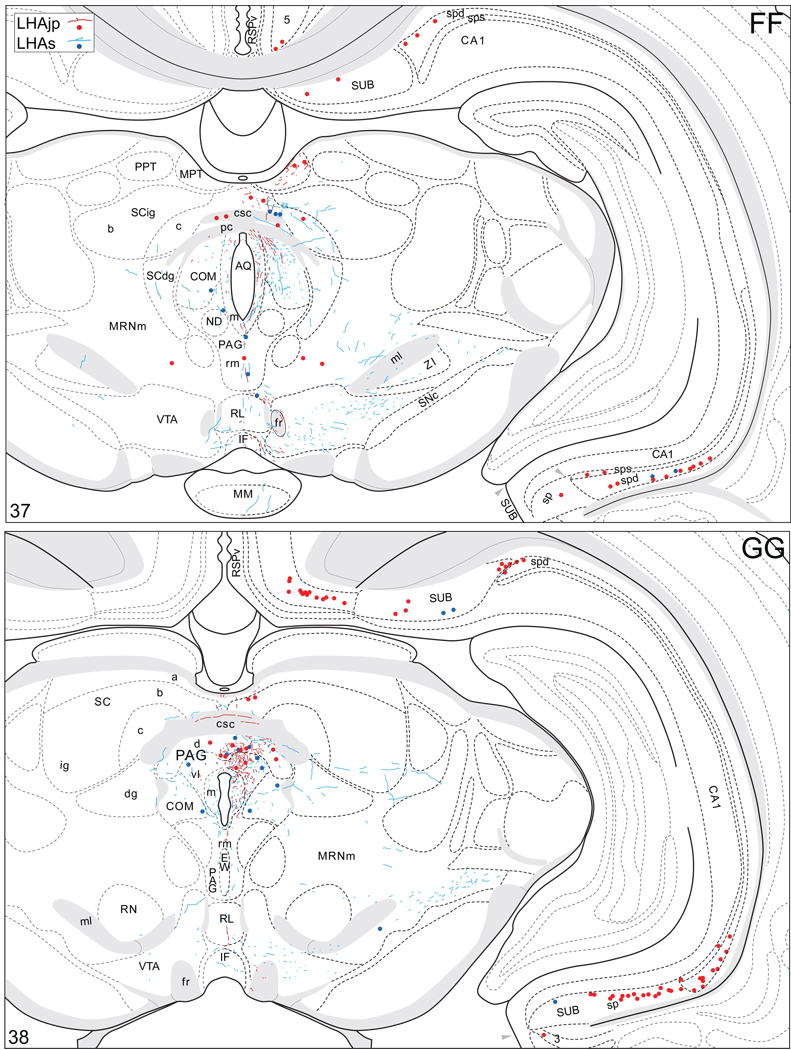
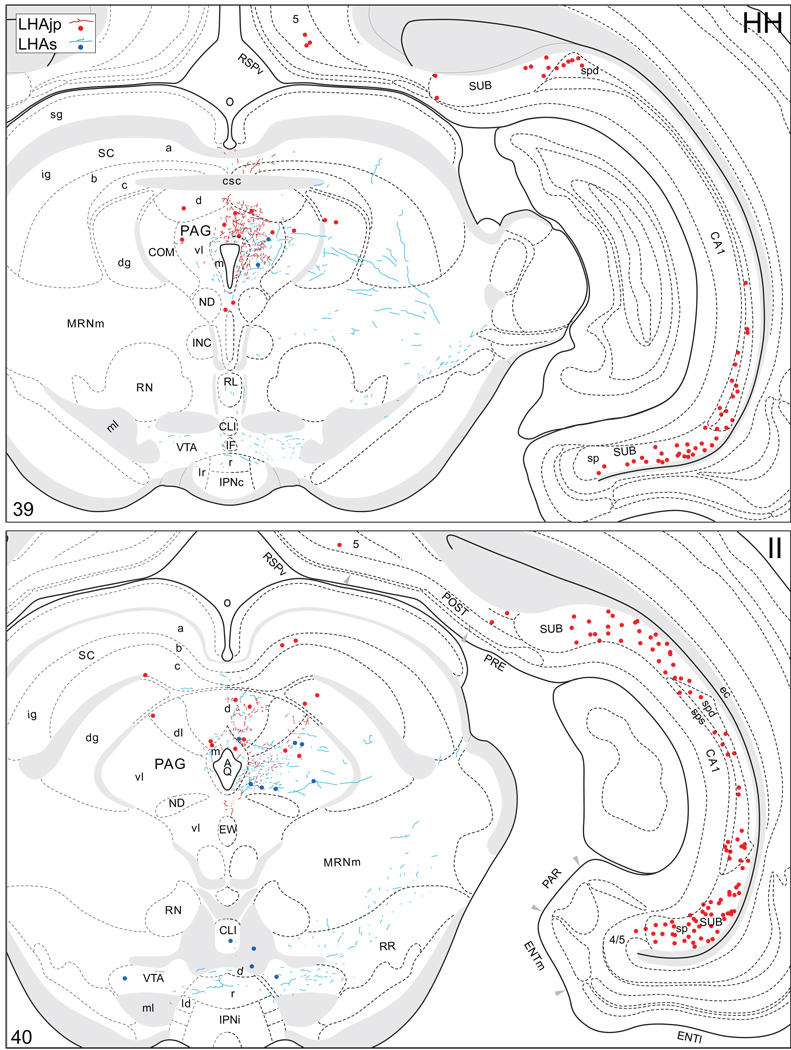
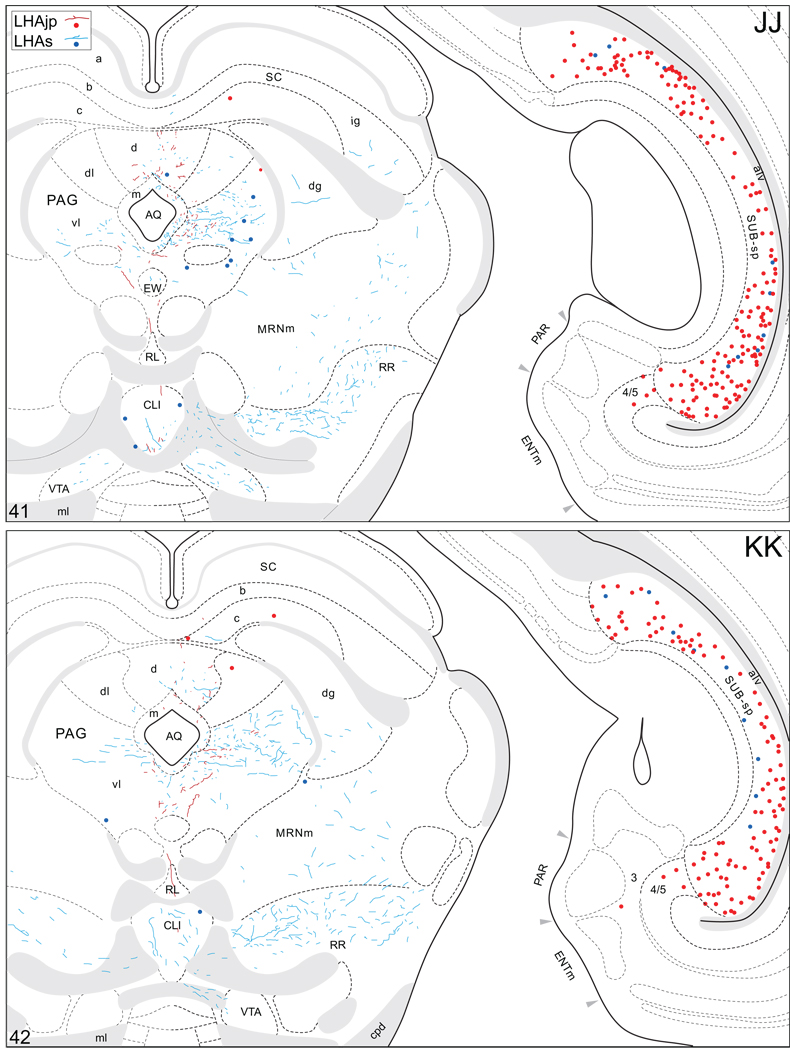
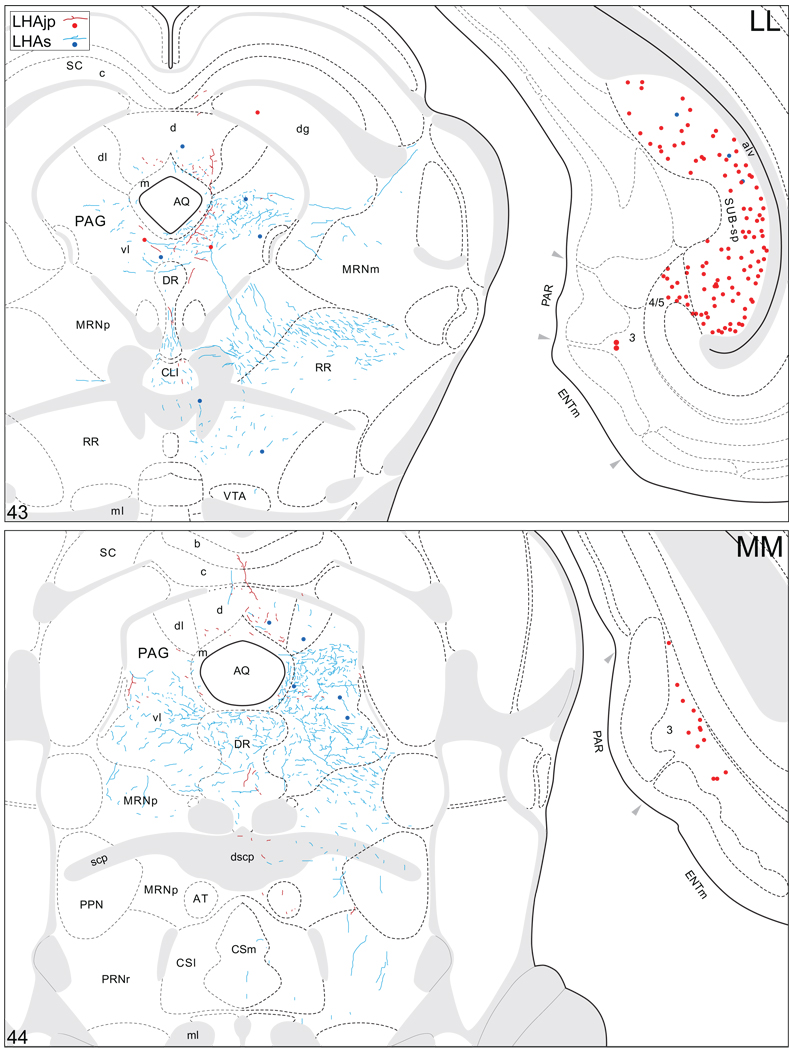
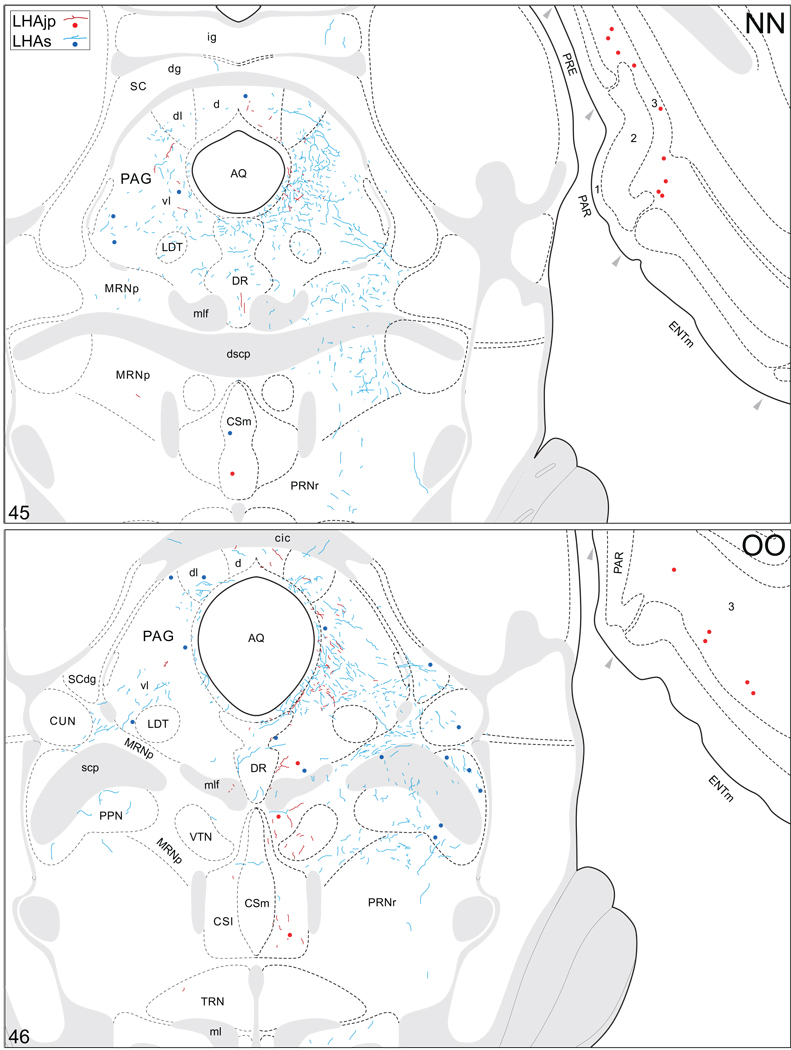
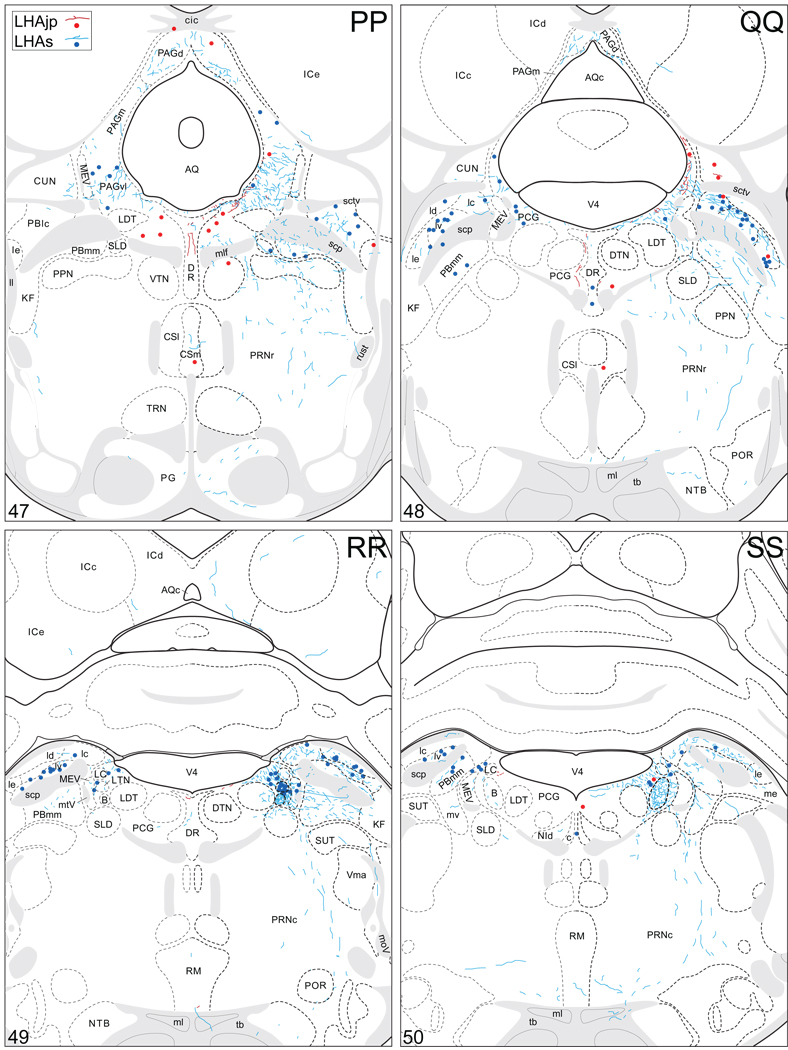
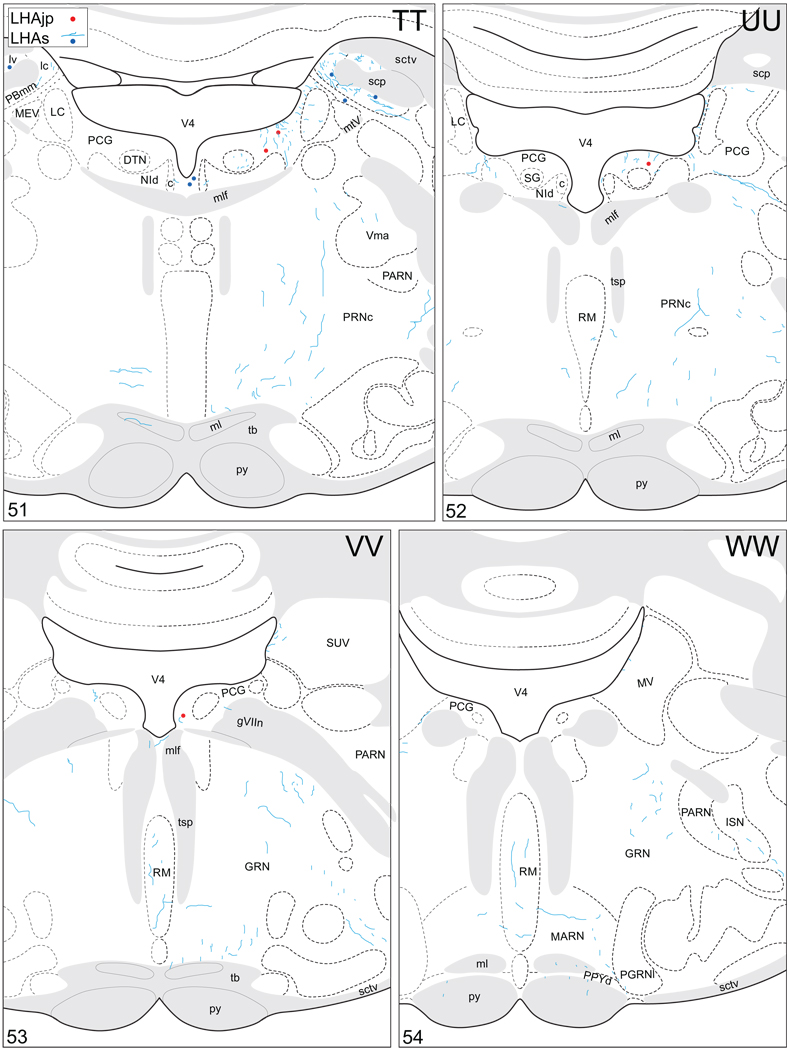
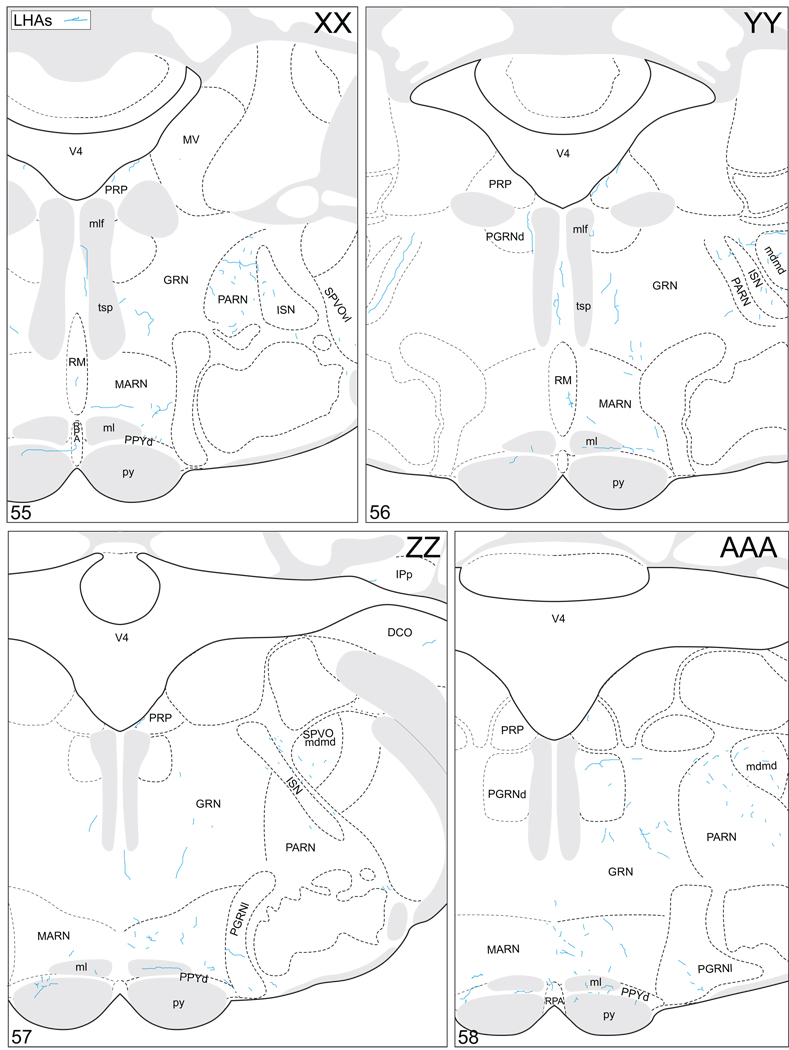
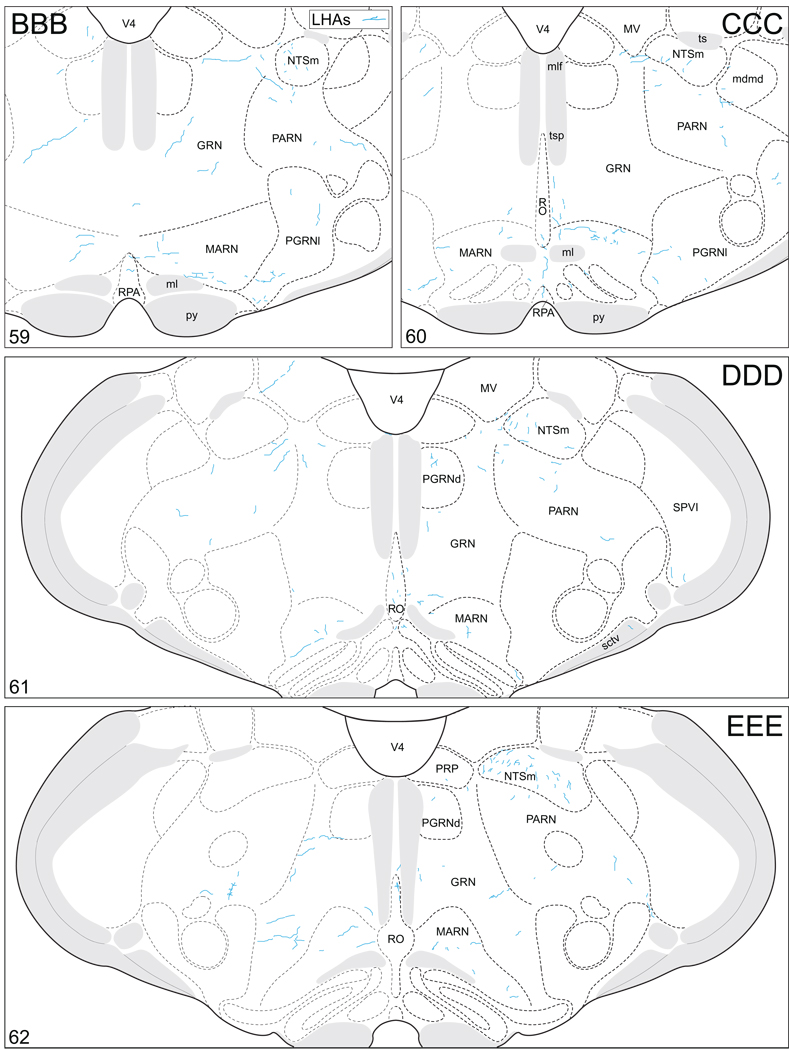
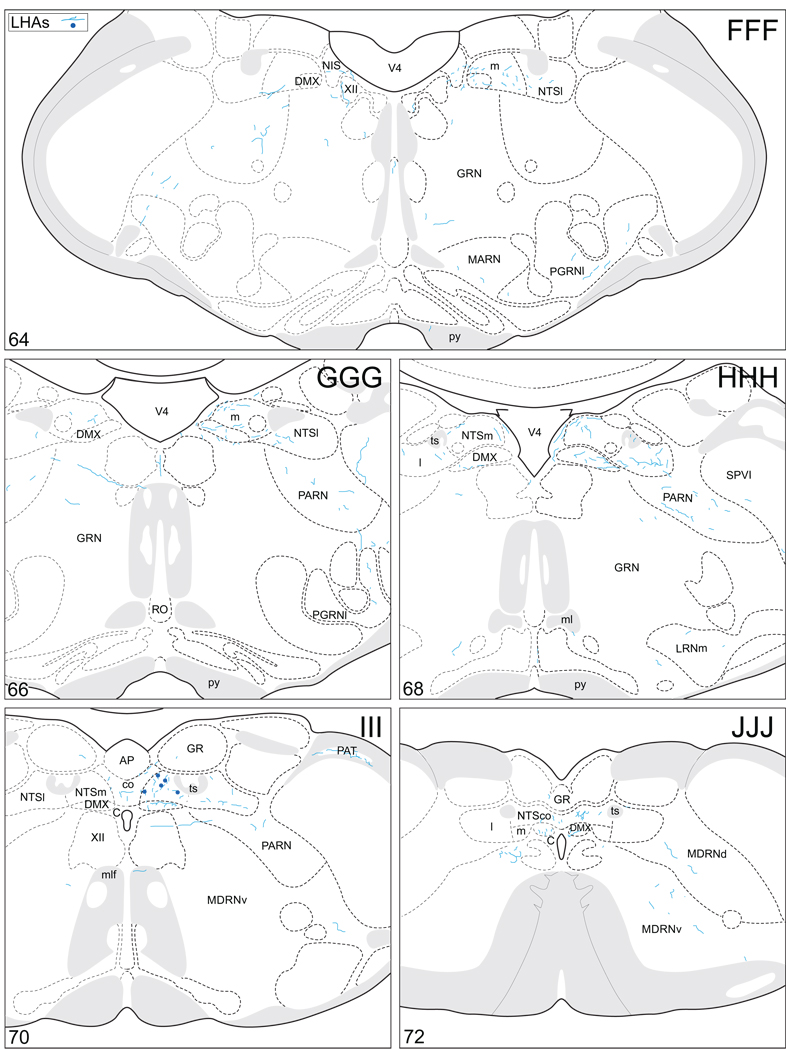
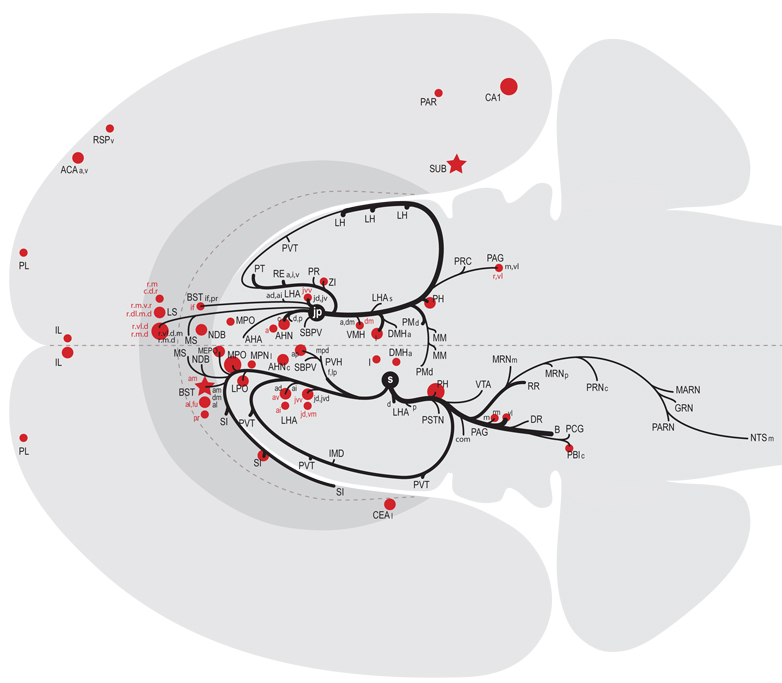
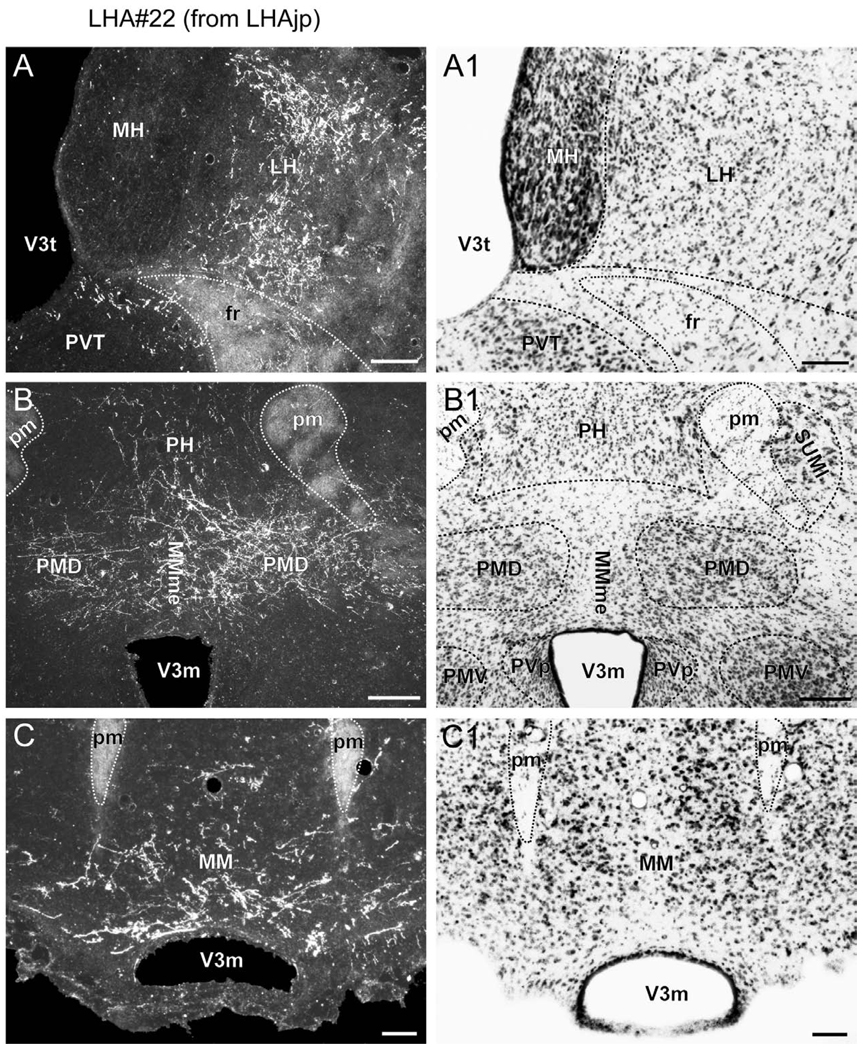
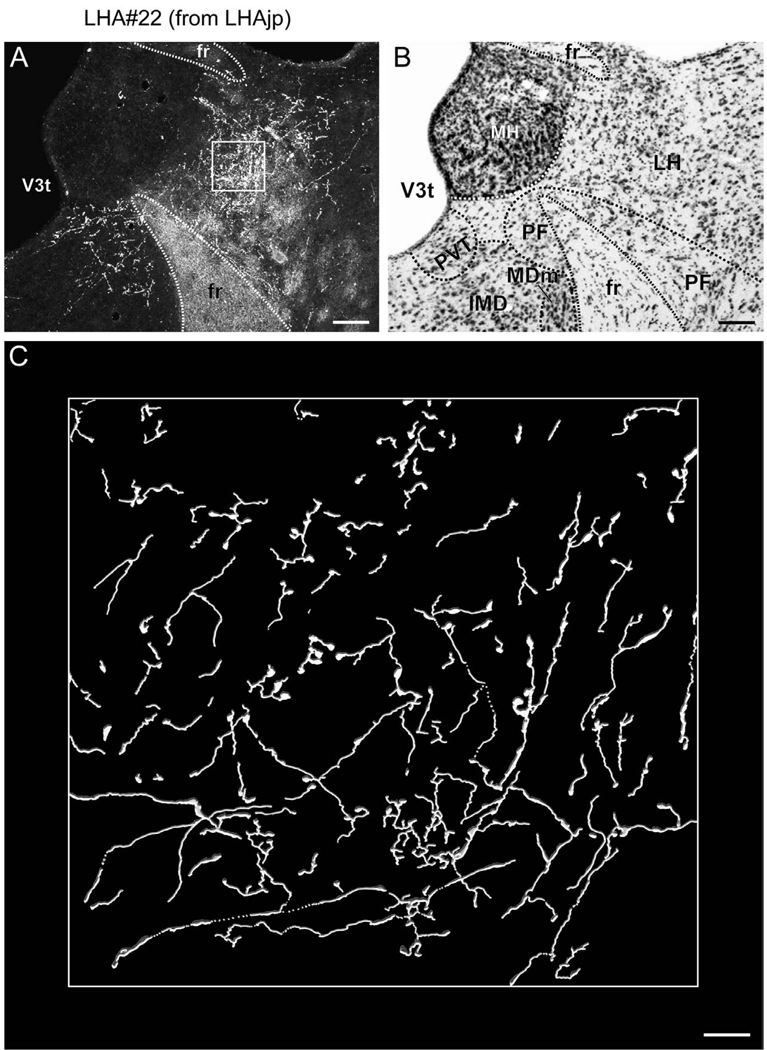
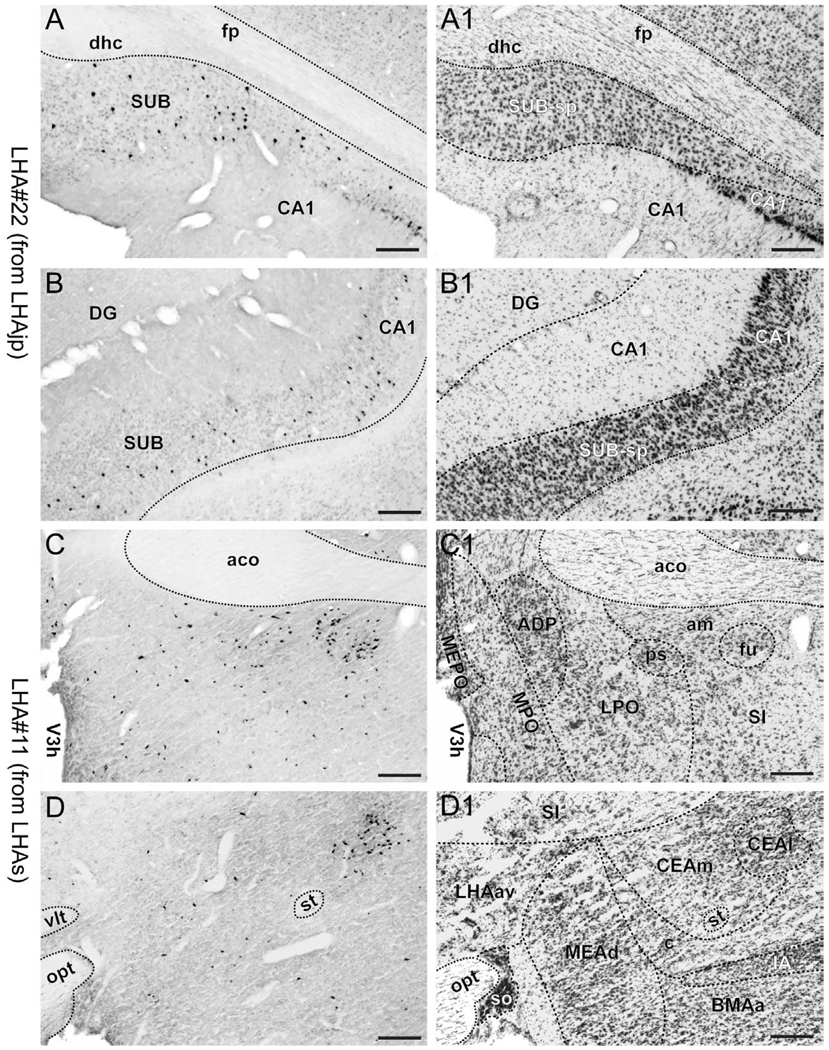
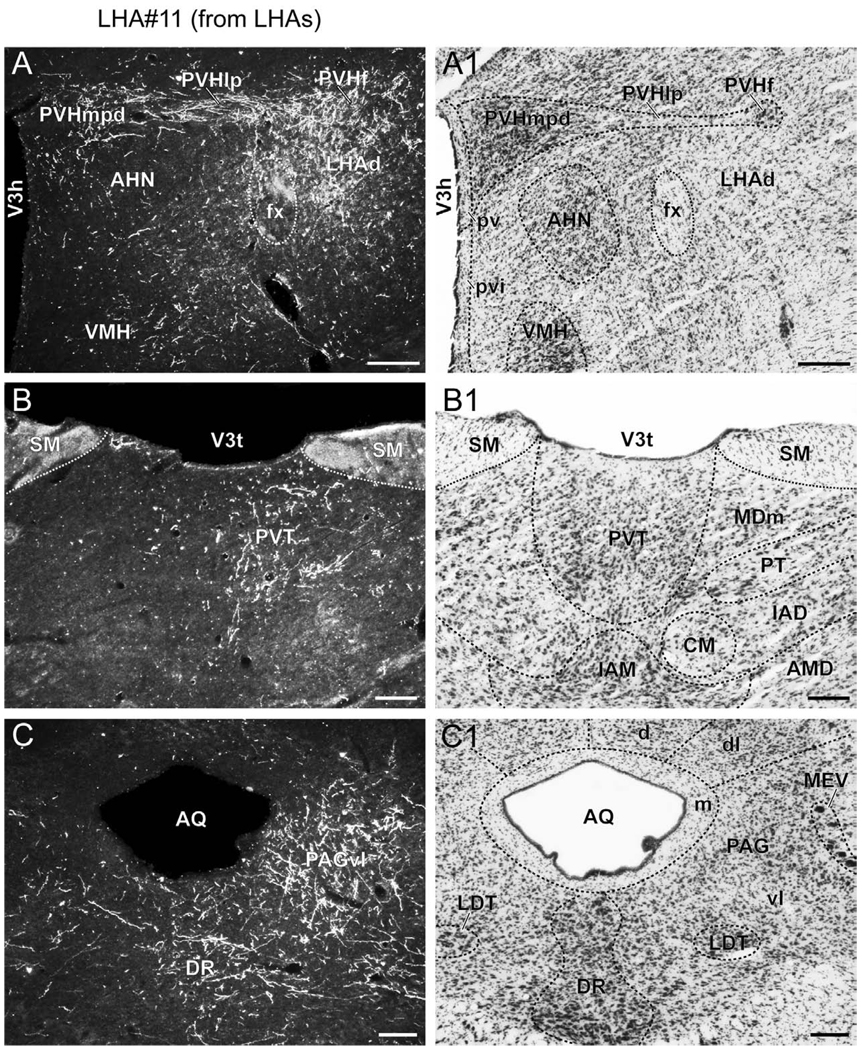
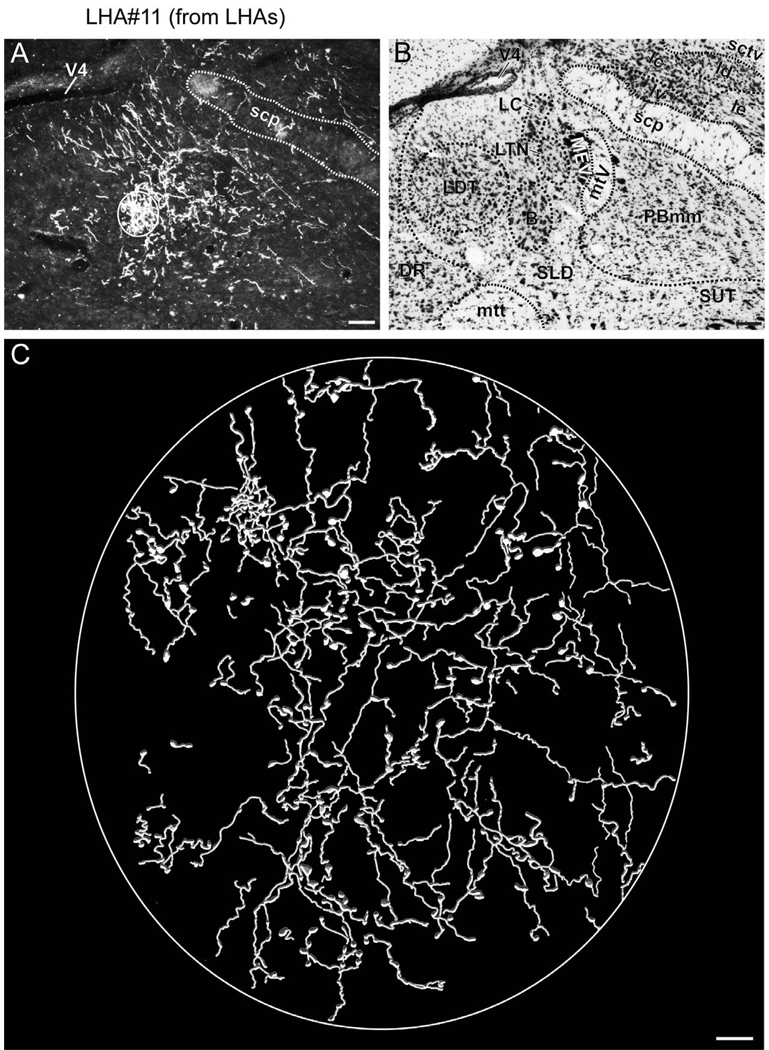
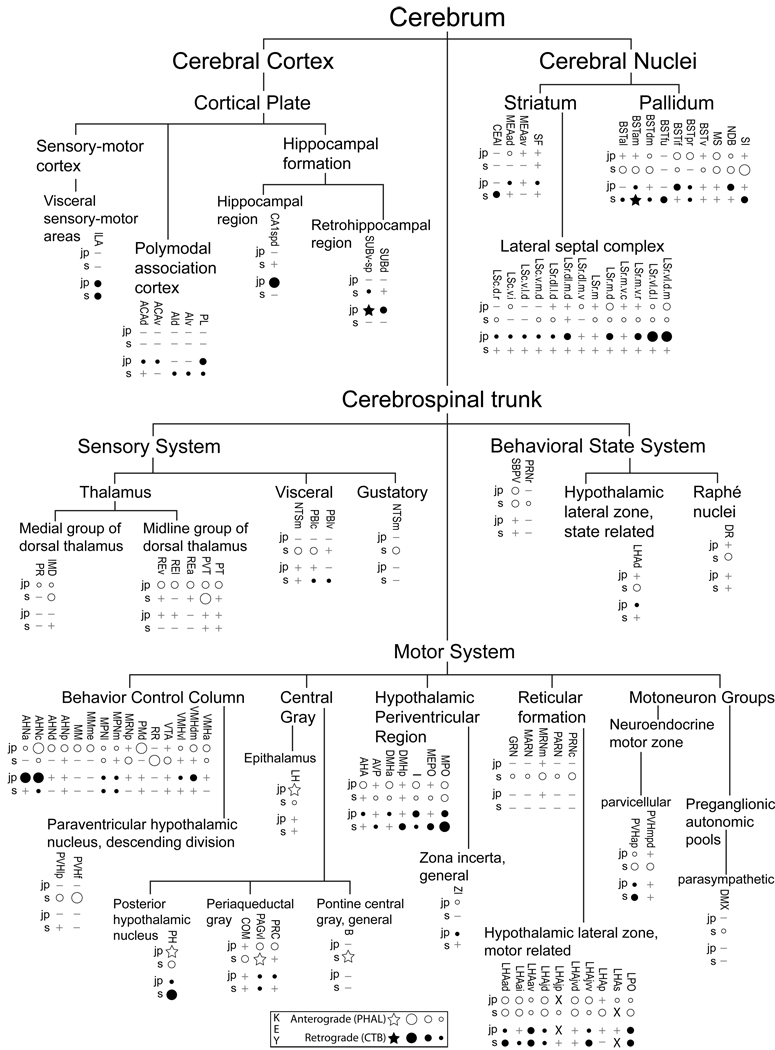
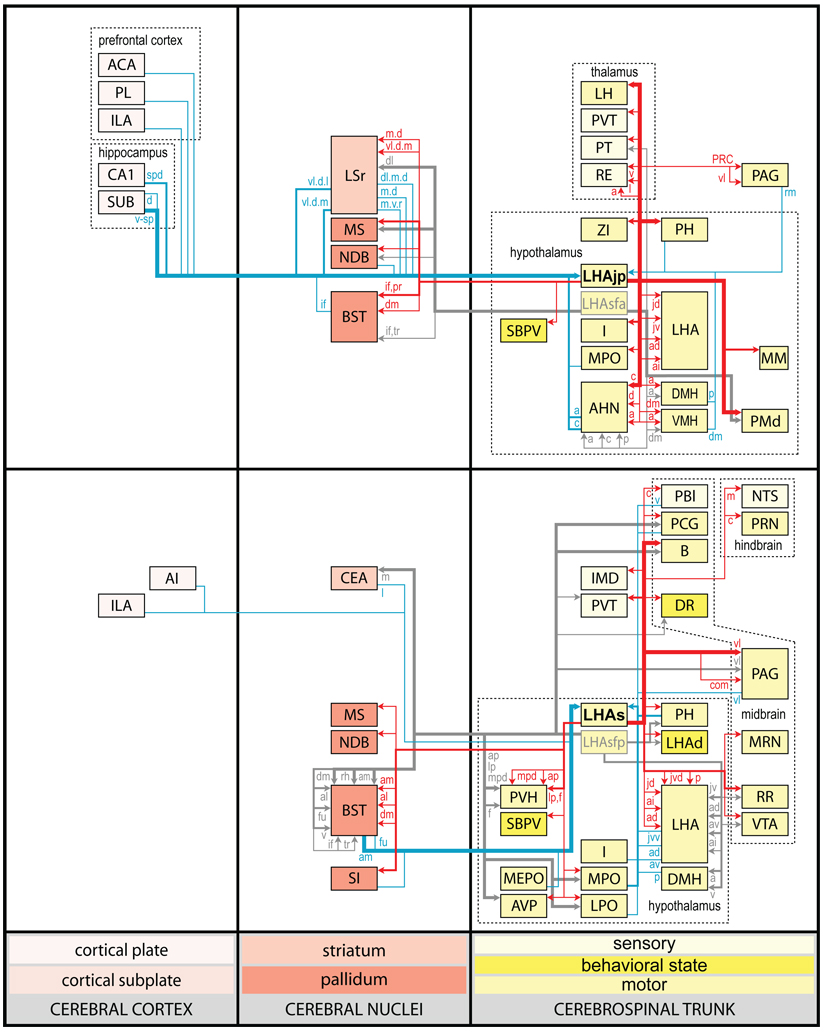
We have analyzed at high resolution the neuroanatomical connections of the juxtaparaventricular region of the lateral hypothalamic area (LHAjp); as a control and in comparison to this, we also performed a preliminary analysis of a nearby LHA region that is dorsal to the fornix, namely the LHA suprafornical region (LHAs). The connections of these LHA regions were revealed with a coinjection tract-tracing technique involving a retrograde (cholera toxin B subunit) and anterograde (Phaseolus vulgaris leucoagglutinin) tracer. The LHAjp and LHAs together connect with almost every major division of the cerebrum and cerebrospinal trunk, but their connection profiles are markedly different and distinct. In simple terms, the connections of the LHAjp indicate a possible primary role in the modulation of defensive behavior; for the LHAs, a role in the modulation of ingestive behavior is suggested. However, the relation of the LHAjp and LHAs to potential modulation of these behaviors, as indicated by their neuroanatomical connections, appears to be highly integrative as it includes each of the major functional divisions of the nervous system that together determine behavior, i.e., cognitive, state, sensory, and motor. Furthermore, although a primary role is indicated for each region with respect to a particular mode of behavior, intermode modulation of behavior is also indicated. In summary, the extrinsic connections of the LHAjp and LHAs (so far as we have described them) suggest that these regions have a profoundly integrative role in which they may participate in the orchestrated modulation of elaborate behavioral repertoires.


Figures

Figure 1
Figure 1
Representative photomicrographs of LHAs and LHAjp cytoarchitecture. (A and B) Brightfield photomicrographs of thionin stained transverse sections showing the cytoarchitecture and boundaries of the lateral hypothalamic area juxtaparaventricular region (LHAjp) at a caudal level (A) and the LHA suprafornical region (LHAs) at a midrostrocaudal level (B). Boundaries of brain regions (dashed lines) and fiber tracts (finer dashed lines) correspond approximately to those delineated in an atlas of the rat brain (Swanson, 2004). A list of abbreviations used in this figure (and throughout this paper) is present from the second page of this paper. Scale bars = 100 µm.
Figure 2
Figure 2
Representative photomicrographs of PHAL and CTB injections sites. (A and B) Brightfield photomicrographs showing immunocytochemically identified deposits of cholera toxin B subunit (CTB) tracer for experiment LHA#22 within caudal levels of the lateral hypothalamic area juxtaparaventricular region (LHAjp) (A) and experiment LHA#11 within midrostrocaudal levels of the LHA suprafornical region (LHAs) (B). (A1 and B1) Thionin stained sections adjacent to the sections shown in (A, A2) and (B, B2). (A2 and B2) Darkfield photomicrographs showing immunocytochemically identified deposits of Phaseolus vulgaris leucoagglutinin (PHAL) tracer for experiment LHA#22 within caudal levels of the LHAjp (A2) and experiment LHA#11 within the midrostrocaudal levels of the LHAs (B2). Approximate boundaries of brain regions (dashed lines) and fiber tracts (finer dashed lines) correspond to those delineated in an atlas of the rat brain (Swanson, 2004). Scale bars = 100 µm.
Figure 3
Figure 3
Plots of injection sites for representative experiments. The approximate extent of deposition sites for seven different tract-tracing experiments resulting from a combined injection of cholera toxin B subunit (CTB) and Phaseolus vulgaris leucoagglutinin (PHAL). The experiments presented involved either the lateral hypothalamic area juxtaparaventricular (LHAjp) or suprafornical (LHAs) regions, or immediately adjacent regions, to a greater or lesser extent as shown. Each experiment is represented by a different color, with PHAL-labeled cells shown as colored dots and the approximate extent of each CTB deposit shown in colored outline. All injections were unilateral, but for clarity the CTB site outlines are transposed to the contralateral side of the atlas plates. These data were plotted with the aid of the camera lucida method from tissue sections containing immunocytochemically detected PHAL and CTB, and with reference to an adjacent set of thionin stained sections; the plots were then transposed to corresponding atlas plates. Approximate boundaries of brain regions (dashed lines) and the shown fiber tracts (grayed areas) correspond to those delineated in an atlas of the rat brain (Swanson, 2004).
Figure 4
Figure 4
Projections from and to the LHAjp and the LHAs. The distribution of Phaseolus vulgaris leucoagglutinin (PHAL)-labeled axons is represented by the colored lines (red = LHAjp experiment #22; blue = LHAs experiment #11). Cholera toxin B subunit (CTB) retrogradely labeled neurons are represented as colored dots with black outlines (red = LHAjp experiment #22; blue = LHAs experiment #11); one dot = one labeled neuron. The data is plotted onto a series of rat brain reference templates derived from Swanson (2004) and arranged from rostral to caudal (A-JJJ); atlas levels are indicated by a numeral in the lower left corner of each figure. PHAL-filled cells at the site of the injection sites are indicated by colored dots with a white outline (red = LHAjp experiment #22; blue = LHAs experiment #11); the approximate extent of the visualized CTB injection site is indicated by a colored area with a black outline (red = LHAjp experiment #22; blue = LHAs experiment #11). It should be noted that in any given region where neurons retrogradely labeled from the LHAs and LHAjp are intermingled it is possible that a portion of them may project to both sites.
Figure 4
Figure 4
Projections from and to the LHAjp and the LHAs. The distribution of Phaseolus vulgaris leucoagglutinin (PHAL)-labeled axons is represented by the colored lines (red = LHAjp experiment #22; blue = LHAs experiment #11). Cholera toxin B subunit (CTB) retrogradely labeled neurons are represented as colored dots with black outlines (red = LHAjp experiment #22; blue = LHAs experiment #11); one dot = one labeled neuron. The data is plotted onto a series of rat brain reference templates derived from Swanson (2004) and arranged from rostral to caudal (A-JJJ); atlas levels are indicated by a numeral in the lower left corner of each figure. PHAL-filled cells at the site of the injection sites are indicated by colored dots with a white outline (red = LHAjp experiment #22; blue = LHAs experiment #11); the approximate extent of the visualized CTB injection site is indicated by a colored area with a black outline (red = LHAjp experiment #22; blue = LHAs experiment #11). It should be noted that in any given region where neurons retrogradely labeled from the LHAs and LHAjp are intermingled it is possible that a portion of them may project to both sites.
Figure 5
Figure 5
General organization of the principal projections from and to the caudal end of the LHAjp (experiment LHA#22) and midrostrocaudal levels of the LHAs (experiment LHA#11). Anterograde projections are indicated by black lines, retrograde labeling by red discs (or stars). The relative strength of each projection is indicated by the thickness of the black line/diameter of the red disc. Three levels are shown, and for the retrograde labeling a red star is used to indicate the site of most abundant retrograde labeling from the LHAjp or the LHAs. For regions that contained retrogradely labelled cells as well as antereogradely labeled fibers, red type is used to indicate particular subdivisions that were retrogradely labeled; black type indicates regions where anterogade-labelled projecting fibers were present. The flatmap is adapted from Swanson (2004).
Figure 6
Figure 6
(A to C) Representative darkfield photomicrographs showing axons immunoreactive for Phaseolus vulgaris leucoagglutinin (PHAL) tracer in several brain regions following a deposit of PHAL within caudal levels of the lateral hypothalamic area juxtaparaventricular region (LHAjp) (experiment LHA#22). (A1 to C1) Brightfield photomicrographs of adjacent thionin stained sections. Note the presence of substantial labeling in: (A) lateral habenula (LH), (B) dorsal premammillary nucleus (PMd), and (C) medial mammillary nucleus (MM). Approximate boundaries of brain regions (dashed lines) and fiber tracts (finer dashed lines) correspond to those delineated in an atlas of the rat brain (Swanson, 2004). Scale bars = 100 µm in (A) and (A1), 200 µm in (B) and (B1), and 50 µm in (C) and (C1).
Figure 7
Figure 7
(A) Representative darkfield photomicrograph showing axons immunoreactive for Phaseolus vulgaris leucoagglutinin (PHAL) tracer in the region of the lateral habenula (LH) following a deposit of PHAL within caudal levels of the lateral hypothalamic area juxtaparaventricular region (LHAjp) (experiment LHA#22). (B) Brightfield photomicrograph of adjacent thionin stained section. (C) Digitally rendered camera lucida drawing of the area delineated by the white box in (A). Approximate boundaries of brain regions (dashed lines) and fiber tracts (finer dashed lines) correspond to those delineated in an atlas of the rat brain (Swanson, 2004). Scale bars = 100 µm in (A) and (B), 10 µm in (C).
Figure 8
Figure 8
(A to D) Representative brightfield photomicrographs showing perikarya immunoreactive for cholera toxin B subunit (CTB) tracer in several brain regions. (A1 to D1) Thionin stained sections adjacent to the sections shown in (A to D). Images (A) and (B) show retrograde labeling in the dorsal (A) and ventral (B) halves of the intermediate third of the subiculum resulting from a CTB deposit within caudal levels of the lateral hypothalamic area, juxtaparaventricular region (LHAjp) (experiment LHA#22). Images (C) and (D) show retrograde labeling in the region of the bed nuclei stria of the terminalis anteromedial area (BSTam) and fusiform nucleus (BSTfu) (C), and central amygdalar nucleus lateral part (CEAl) (D) resulting from a CTB deposit within midrostrocaudal levels of the lateral hypothalamic area, suprafornical region (LHAs) (experiment LHA#11). Approximate boundaries of brain regions (dashed lines) and fiber tracts (finer dashed lines) correspond to those delineated in an atlas of the rat brain (Swanson, 2004). Scale bars = 100 µm.
Figure 9
Figure 9
(A to C) Representative darkfield photomicrographs showing axons immunoreactive for Phaseolus vulgaris leucoagglutinin (PHAL) tracer in several brain regions following a deposit of PHAL within midrostrocaudal levels of the lateral hypothalamic area suprafornical region (LHAs) (experiment LHA#11). (A1 to C1) Brightfield photomicrographs of adjacent thionin stained sections. Note the presence of PHAL-labeled fibers in: (A) LHA dorsal part (LHAd) and paraventricular hypothalamic nucleus forniceal (PVHf) and lateral parvicellular (PVHlp) parts, (B) paraventricular thalamic nucleus (PVT), (C) periaqueductal gray ventrolateral division (PAGvl) and dorsal raphé nucleus (DR). Approximate boundaries of brain regions (dashed lines) and fiber tracts (finer dashed lines) correspond to those delineated in an atlas of the rat brain (Swanson, 2004). Scale bars = 200 µm in (A) and (A1), 100 µm in (B), (B1), (C) and (C1).
Figure 10
Figure 10
(A) Representative darkfield photomicrograph showing axons immunoreactive for Phaseolus vulgaris leucoagglutinin (PHAL) tracer in the region of Barrington's nucleus (B) following a deposit of PHAL within midrostrocaudal levels of the lateral hypothalamic area suprafornical region (LHAs) (experiment LHA#11, see Fig. 2). (B) Brightfield photomicrograph of adjacent thionin stained section. (C) Digitally rendered camera lucida drawing of the area delineated by the white oval in (A). Approximate boundaries of brain regions (dashed lines) and fiber tracts (finer dashed lines) correspond to those delineated in an atlas of the rat brain (Swanson, 2004). Scale bars = 100 µm in (A) and (B), 10 µm in (C).
Figure 11
Figure 11
A lateral view of Ammon’s horn and the subiculum projected on the right cerebral hemisphere of the rat. The curved longitudinal axis of these parts of the hippocampal formation is indicated by a dashed line, with D at the dorsal or septal end and V at the ventral or temporal end. Dashed lines a and b are transverse to the longitudinal axis and divide qualitatively Ammon's horn and the subiculum into approximate dorsal, intermediate, and ventral thirds for descriptive purposes. The transverse solid line 1 divides qualitatively Ammon’s horn and the subiculum into dorsal and ventral halves for descriptive purposes. OB, olfactory bulb (rostral end of cerebral hemisphere). Adapted from Swanson and Cowan (1977). It is noteworthy that the site of the most abundant retrograde labeling in this study identified a projection to the LHAjp from the ventral half (predominantly) of the intermediate third of the subiculum.
Figure 12
Figure 12
All regions of approximately moderate or higher anterograde (white-filled dots) and retrograde (black dots) labeling resulting from deposits of Phaseolus vulgaris leucoagglutinin (PHAL) and cholera toxin B sububit (CTB) within the lateral hypothalamic area juxtaparaventricular region (LHAjp; combined analysis of caudal LHAjp experiment LHA#22 and rostral LHAjp experiment LHA#62) or LHA suprafornical region (LHAs; midrostrocaudal level, experiment LHA#11) represented within a cerebral hierarchy. Regions in which the overall level of labeling amounted to approximately moderate (or above) are represented even if the constituent subregions contained a lower level of labeling (e.g., the MPN). For a more detailed comparison of the connections of caudal and rostral levels of the LHAjp (for experiment LHA#22 and LHA#62, respectively) and midrostrocaudal levels of the LHAs (for experiment LHA#11) see Fig. 4 and Table 1. The diameter of the round symbols corresponds to the relative abundance of labeling, 3 levels are represented: low, moderate and high. Stars indicate sites of highest abundance of labeling; “+” signs indicate the presence of labeling at a very low level; “−” signs indicate absence of labeling. “X” indicates the site of tracer injections.
Figure 13
Figure 13
Summary diagram illustrating the major axonal inputs and outputs of the LHAjp (combined experiment LHA #22 and LHA #62) and midrostrocaudal levels of the LHAs (experiment LHA #11) represented within a cerebral hierarchy (see Swanson, 2004). Red lines indicate outputs and blue lines indicate inputs; directionality is also indicated by arrowheads. The thickness of each line corresponds to the relative magnitude of each projection. Small colored lettering indicates subdivisions of larger regions that are specifically targeted or that specifically provide an indicated input. For comparison, also shown (gray lines with gray arrow heads and gray lettering) are the previously published outputs of the LHA subfornical region (LHAsf) (Goto et al., 2005); note the similarity between the outputs or projections of the posterior zone of the LHAsf (LHAsfp) and midrostrocaudal levels of the LHAs, and the anterior zone of the LHAsf (LHAsfa) (Goto et al., 2005) and the LHAjp.

Similar articles

Cited by

References

    1. Abrahamson EE, Moore RY. The posterior hypothalamic area: chemoarchitecture and afferent connections. Brain Res. 2001;889:1–22. - PubMed
    1. Aggleton JP, Vann SD, Saunders RC. Projections from the hippocampal region to the mammillary bodies in macaque monkeys. Eur J Neurosci. 2005;22:2519–2530. - PubMed
    1. Alam MN, Gong H, Alam T, Jaganath R, McGinty D, Szymusiak R. Sleep-waking discharge patterns of neurons recorded in the rat perifornical lateral hypothalamic area. J Physiol. 2002;538:619–631. - PMC - PubMed
    1. Albert DJ, Chew GL. The septal forebrain and the inhibitory modulation of attack and defense in the rat. A review. Behav Neural Biol. 1980;30:357–388. - PubMed
    1. Alden M, Besson JM, Bernard JF. Organization of the efferent projections from the pontine parabrachial area to the bed nucleus of the stria terminalis and neighboring regions: a PHA-L study in the rat. J Comp Neurol. 1994;341:289–314. - PubMed

Publication types

LinkOut - more resources