. 2010 May 14;320(1-2):76-86.
doi: 10.1016/j.mce.2010.02.014. Epub 2010 Feb 17.

Glucocorticoid receptor knock down reveals a similar apoptotic threshold but differing gene regulation patterns in T-cell and pre-B-cell acute lymphoblastic leukemia

Affiliations

Glucocorticoid receptor knock down reveals a similar apoptotic threshold but differing gene regulation patterns in T-cell and pre-B-cell acute lymphoblastic leukemia

Jason R Schwartz et al. Mol Cell Endocrinol. .

Abstract

Glucocorticoids (GCs) are used in combination therapy for treating acute lymphoblastic leukemia (ALL). In T-cell (CEM-C7) and pre-B-cell (697) ALL cell lines, dexamethasone (Dex) treatment causes an auto-upregulation of glucocorticoid receptor (GR) mRNA transcripts and protein. We hypothesized that there is a threshold level of GR transcripts/protein needed for cells to respond to the apoptosis-inducing effects of hormone. GR knock down using a doxycycline-controllable shRNAmir indicated that the apoptotic response changes from sensitive to resistant with changing GR levels. Titration of the 697 cell GR to equal that of the CEM-C7 T-cell ALL line caused a shift in sensitivity to that seen in CEM-C7 cells. While the same level of GR is required to trigger apoptosis in both T-cell and pre-B-cell ALL lineages, similarities and differences were observed for the regulation of target genes in these lineages. These preliminary gene regulation patterns may lead to the development of a molecular signature for GC-sensitive and GC-resistant leukemia cells.


Figures

Figure 1
Figure 1
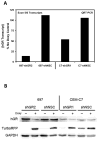
Controllable GR knock down in ALL cell lines. A) GR mRNA transcript measurements were performed via QRT-PCR with a probe and primer set specific for all GR RNA transcripts (containing the exon 5/6 junction); the resulting measurement is representative of the total GR transcript level. The data are normalized to endogenous 18S rRNA levels in each respective sample and expressed as the percent of the total GR measured in the matched non-Doxy treated sample. Total RNA was isolated following 48 hours of Doxy treatment. The concentration of Doxy used for treating 697-shGR2 and C7-shGR1 cells was 250 ng/ml and 500 ng/ml, respectively; at these concentrations RFP expression was saturated. B) Western blot analysis showing the expression levels of GR, TurboRFP, and GAPDH in 697-shGR2 and C7-shGR1 with and without Doxy treatment (concentrations the same as in A).
Figure 2
Figure 2
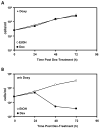
GR knock down results in resistance to GC-mediated apoptosis. A & C) 697-shGR2 and 697-shNSC cells were pre-treated or not with Doxy and subsequently treated with 1 μM Dex or an equal volume of EtOH. Apoptosis assays were quantitated via Trypan Blue exclusion and hemacytometry 48 hours after treatment. B & D) Apoptosis assays were performed as in A & C with C7-shGR1 and C7-shNSC cells except the data were obtained 72 hours after hormone or vehicle treatment. Error bars represent the standard error of the mean of 3 separate experiments. A 2-sample t-test was used to test for statistically significant differences between GR knock down cell lines +/− Doxy.
Figure 3
Figure 3
GR resistance is reversible. A) The 697-shGR2-F5 clone was pre-treated with Doxy for 48 hours and subsequently treated with 1 μM Dex or an equal volume of EtOH. After 72 hours of treatment, the Dex-treated cells were washed with PBS (4–5 times over 72 hours) and cultured in fresh media without Doxy. B) After 72 hours RFP expression had nearly ceased and the washed and re-cultured cells were re-treated with either 1 μM Dex or an equal volume of EtOH. Assays were quantitated via Trypan Blue exclusion and hemacytometry.
Figure 4
Figure 4
GR specific shRNAmir sequences reduce both mRNA and protein expression. 697 and CEM-C7 cells stably transduced with a GR-specific shRNAmir lentivirus were treated with 2-fold serial dilutions of Doxy, starting at a concentration of 1 μg/mL (rightmost sample). The total GR (containing the exon 5/6 junction) transcript concentration was measured with QRT-PCR in 697-shGR2 (A) and C7-shGR1 (B) cells after 48 hours of Doxy pre-treatment followed by 18 hours of Dex treatment. (†) notes, in A, the Dex-induced transcript level after pre-treatment with Doxy that corresponds to the same Doxy concentrations within which the biological response switches (see Fig. 5A ). C & D) Expression levels of GR, turboRFP, and GAPDH proteins were analyzed by western blotting following the same treatment regimen as in A and B. During these studies one 697-shGR2 sample was lost; therefore, in C, the highest Doxy concentration analyzed was 500 ng/mL. This does not affect the interpretation of the data.
Figure 5
Figure 5
The biological response to Dex shifts between a narrow range of functional GR levels in 697 cells. A) LCS values at 48 hours post-Dex treatment in 697-shGR2 cells are plotted versus the Doxy concentrations (48 hour pre-treatment prior to Dex). Following the initial experiment using the full 2-fold Doxy serial dilution (open circles), a second experiment was completed with a finer Doxy titration from 7 ng/mL to 17 ng/mL (gray circles). B) LCS values at 72 hours post-Dex-treatment in C7-shGR1 cells pre-treated with 2-fold dilutions of Doxy for 48 hours. LCS values were calculated from a flow cytometric apoptosis analysis using the Vybrant® Apoptosis Assay Kit #4. The curve fits are theoretical calculations via the following equation: y=(Range1+(xED50)s)+Background C) Compilation of the 697 cell data. Cell viability (open circles) and Dex-induced GR transcript (gray triangles) and protein expression (black squares) are plotted versus the pre-treatment Doxy concentration used in the experiment with 697-shGR2 cells. Expression levels of GR transcripts and protein shown are plotted as the calculated percentages of the maximum Dex-induced expression values from QRT-PCR (transcripts) and densitometery (protein) performed on the western blot shown in Figure 4. The vertical dotted arrow indicates that a GR expression level above ~20–25% is required for triggering some degree of GC-mediated apoptosis in these cells. The curve fits are theoretical calculations via the same equation used in Figure 5A. The calculated Doxy ED50 values for GR transcripts, GR protein, and cell viability are 10.5 ng/mL, 11.3 ng/mL, and 15.2 ng/mL, respectively.
Figure 6
Figure 6
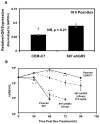
Manipulation of functional GR level changes the apoptosis rate. A) Densitometry values of 3 biological replicates of Dex-treated 697-shGR2 cells pre-treated with 12.5 ng/mL Doxy and of Dex-treated parental CEM-C7 cells. Values are expressed as relative GR expression, normalized to GAPDH protein expression. The p value is that of a 2-tailed t-test assuming equal variances. (†) indicates that the CEM-C7 values were divided by 2 because CEM-C7 cells are functionally haploinsufficient for GR. B) Cell viability was measured by Trypan Blue exclusion and hemacytometry of cells treated as in A. Error bars represent the SEM; n=3 for all cell lines except 697-shGR2 (12.5 ng/mL Doxy) where n=4. The parental 697 cell line is shown to demonstrate that the cell death rate of the 697-shGR2 derivative cell line is phenotypically comparable to the parental cell line in the absence of Doxy (no GR knock down). Using the same statistical analysis as in A, 697-shGR2 (12.5 ng/mL Doxy) was compared to either parental CEM-C7 or 697-shGR2 (-Doxy). (*) p<0.05. (**) p<0.01. (***) p<0.001.
Figure 7
Figure 7
Cell cycle analysis of cell lines. Cells were treated for the indicated times with either 1 μM Dex or an equal volume of the EtOH vehicle. After staining with propidium iodide, cell cycle analysis was performed to analyze the DNA content in individual cells. The percentage of sub-G1 cells as compared to the total number of cells analyzed for each sample is shown.
Figure 8
Figure 8
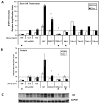
Basal versus GC-induced GR transcript and protein levels in cell lines and patient samples. A) QRT-PCR analysis was performed using the probe specific for GR transcripts containing the exon 5/6 junction in various cell lines and 4 fresh, ALL patient samples. All cells were treated for 18 hours with either 1 μM Dex or an equal volume of the EtOH vehicle. Data are expressed as relative amplification units (RAU), and all samples were normalized to their respective internal 18S rRNA expression level. Symbols: (✱) denotes cells that are resistant to GC-mediated apoptosis; all other cells are sensitive. (†) indicates that both CEM-C7 and CEM-C1 RAU values were divided by 2 as both are functionally haploinsufficient for GR. The dotted line marks the apparent GR threshold that must be reached to trigger GC-mediate apoptosis. Error bars represent the SEM of 3 separate biological replicates where possible (i.e., there are no error bars for the patient samples as the RNA samples were from a single treatment experiment due to the minimal amount of patient material received). B) Quantitative western blotting of the GR proteins bands after SDS-PAGE. All cells were treated with 1 μM Dex or an equal volume of the EtOH vehicle for 18 hours prior to extraction. Three separate experiments were performed and the data are the means ± the SEM. C) Representative western blot of the cell line samples. For B) and C), there was not enough material from the patient samples to allow quantitative western blotting to be performed.
Figure 9
Figure 9
Multiplex analysis of the gene expression in 697-shGR2 and C7-shGR1 cells titrated with a 2-fold serial dilution of Doxy, followed by EtOH or Dex. A) Top panel: genes that are up-regulated with GR following 1 μM Dex treatment in 697-shGR2 cells. Bottom panel: genes that are down-regulated oppositely to the upregulation of GR following 1 μM Dex treatment in 697-shGR2 cells. Irrespective of the direction, the regulation of the genes shown is in a titrated manner that corresponds to the titrated GR levels. B) Genes that are up-regulated with GR following 1 μM Dex treatment in C7-shGR1 cells. Data are expressed as GeXP normalized expression values; they are normalized to HPRT, β-actin, 18S rRNA, and α-tubulin simultaneously and relative to a total RNA standard curve.

Similar articles

Cited by

References

    1. Abrams MT, Robertson NM, Yoon K, Wickstrom E. Inhibition of glucocorticoid-induced apoptosis by targeting the major splice variants of BIM mRNA with small interfering RNA and short hairpin RNA. J Biol Chem. 2004;279:55809–55817. - PubMed
    1. Ashraf J, Kunapuli S, Chilton D, Thompson EB. Cortivazol mediated induction of glucocorticoid receptor messenger ribonucleic acid in wild-type and dexamethasone-resistant human leukemic (CEM) cells. J Steroid Biochem Mol Biol. 1991;38:561–568. - PubMed
    1. Ashraf J, Thompson EB. Identification of the activation-labile gene: a single point mutation in the human glucocorticoid receptor presents as two distinct receptor phenotypes. Mol Endocrinol. 1993;7:631–642. - PubMed
    1. Bachmann PS, Gorman R, Papa RA, Bardell JE, Ford J, Kees UR, Marshall GM, Lock RB. Divergent mechanisms of glucocorticoid resistance in experimental models of pediatric acute lymphoblastic leukemia. Cancer Res. 2007;67:4482–4490. - PubMed
    1. Barrett TJ, Vig E, Vedeckis WV. Coordinate regulation of glucocorticoid receptor and c-jun gene expression is cell-type specific and exhibits differential hormonal sensitivity for down- and up-regulation. Biochemistry. 1996;35:9746–9753. - PubMed

Publication types

MeSH terms