. 2010 Mar 12;86(3):399-410.
doi: 10.1016/j.ajhg.2010.02.002. Epub 2010 Feb 18.

Systems genetics analysis of gene-by-environment interactions in human cells

Affiliations

Systems genetics analysis of gene-by-environment interactions in human cells

Casey E Romanoski et al. Am J Hum Genet. .

Abstract

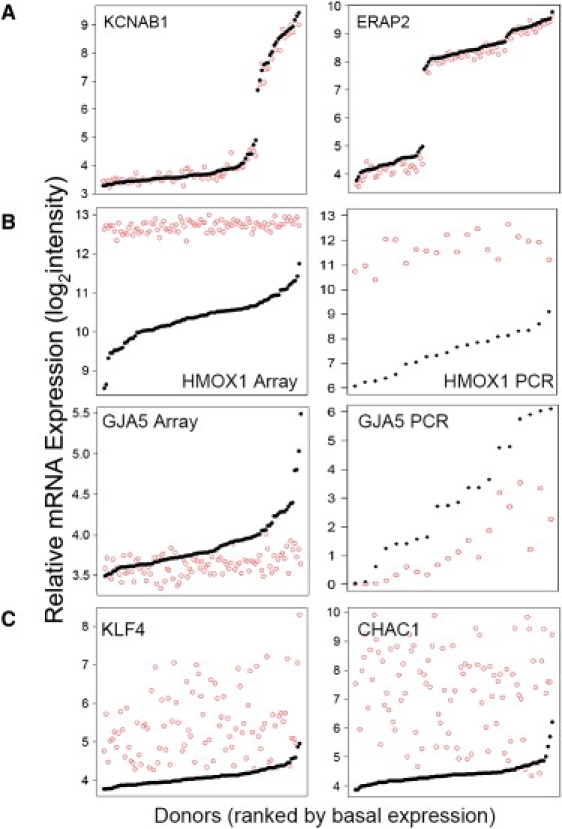
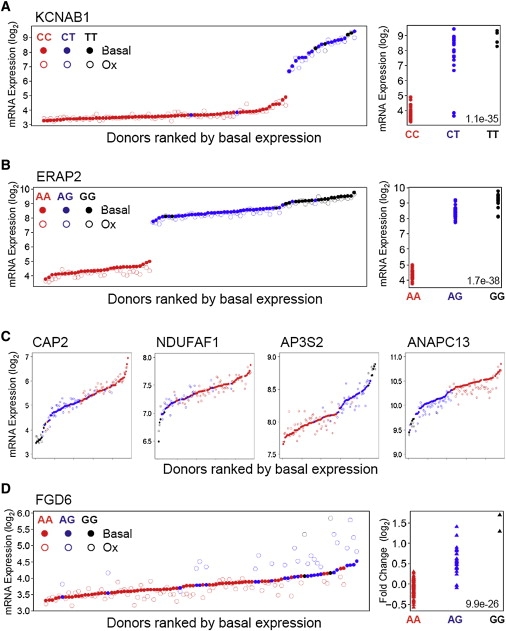
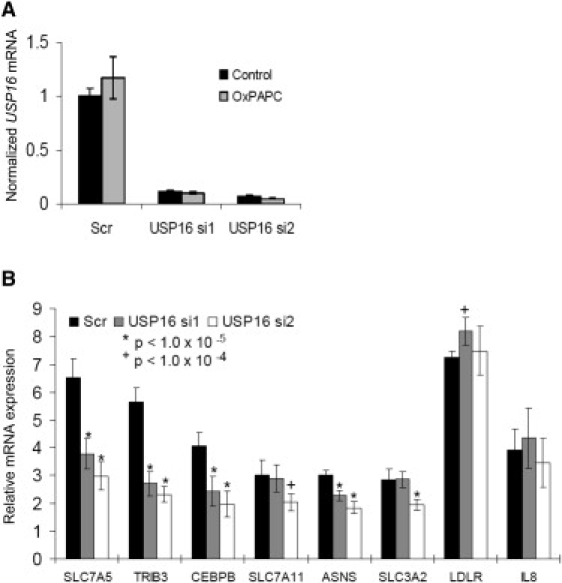
Gene by environment (GxE) interactions are clearly important in many human diseases, but they have proven to be difficult to study on a molecular level. We report genetic analysis of thousands of transcript abundance traits in human primary endothelial cell (EC) lines in response to proinflammatory oxidized phospholipids implicated in cardiovascular disease. Of the 59 most regulated transcripts, approximately one-third showed evidence of GxE interactions. The interactions resulted primarily from effects of distal-, trans-acting loci, but a striking example of a local-GxE interaction was also observed for FGD6. Some of the distal interactions were validated by siRNA knockdown experiments, including a locus involved in the regulation of multiple transcripts involved in the ER stress pathway. Our findings add to the understanding of the overall architecture of complex human traits and are consistent with the possibility that GxE interactions are responsible, in part, for the failure of association studies to more fully explain common disease variation.


Figures

Figure 1
Figure 1
Experimental Design
Figure 2
Figure 2
Expression Variation in the HAEC Population Gene expression intensity (y axis) for the indicated transcripts are shown for basal (solid black circles) and Ox-PAPC-treated (open red circles). Variations in the HAEC population are shown in (A) for transcripts KCNAB1 (left) and ERAP2 (right) in which basal levels were variable but unresponsive to Ox-PAPC. In (B), expression variation in HMOX1 (top) and GJA5 (bottom) are shown from microarrays (left) and with RT-PCR (right). Variation in these transcripts was greater at baseline compared to after Ox-PAPC treatment. Transcripts KLF4 (left) and CHAC1 (right), whose Ox-PAPC treated expression was more variable than basal levels, are shown in (C). Donors are rank ordered by basal expression along the x axis and expression values are on a log2 scale (y axis).
Figure 3
Figure 3
HAEC Gene Expression Is Genetically Regulated by Local Variants Expression of KCNAB1 in untreated (solid circles) and Ox-PAPC-treated (open circles) samples are shown in (A). Donors are across the x axis in order of increasing basal expression and colored according to genotypes at the local-eQTL rs6775600. The right-hand plot shows basal transcript values of KCNAB1 as a function of genotype at the same SNP. In (B), expression of ERAP2 is shown according to the same schema described in (A) for local-association to rs27290, and for four additional genes (CAP2 [MIM 601697], NDUFAF1 [MIM 606934], AP3S2 [MIM 602416], and ANAPC13) with respective local-eQTL in (C). (D) shows the local-gxeQTL rs7135847 association to expression levels of FGD6 at basal and after Ox-PAPC treatment (left panel) with the same schema described in (A) and (B). The right panel shows the log2 fold regulation of FGD6 upon Ox-PAPC treatment as a function of genotypes at rs7135847.
Figure 4
Figure 4
gxeHotspots gxeHotspot loci were determined by counting the number of transcripts (y axis) whose response to Ox-PAPC comapped to gxeQTL across the autosomes (x axis). gxeAssociations with p < 7.47 × 10⁻⁷ were considered in this analysis.
Figure 5
Figure 5
USP16 Regulates Target Gene Responsiveness to Ox-PAPC (A) USP16 mRNA message levels were measured by qRT-PCR and normalized to the housekeeping gene B2M after transfection with the scrambled control and two USP16 siRNAs in HAECs. (B) The Ox-PAPC-fold induction for six target genes and the negative control genes IL8 and LDLR. Averages ± SD are shown for both (A) and (B).

References

    1. Ioannidis J.P., Thomas G., Daly M.J. Validating, augmenting and refining genome-wide association signals. Nat. Rev. Genet. 2009;10:318–329. - PMC - PubMed
    1. Hardy J., Singleton A. Genomewide association studies and human disease. N. Engl. J. Med. 2009;360:1759–1768. - PMC - PubMed
    1. Talmud P.J. Gene-environment interaction and its impact on coronary heart disease risk. Nutr. Metab. Cardiovasc. Dis. 2007;17:148–152. - PubMed
    1. Caspi A., Sugden K., Moffitt T.E., Taylor A., Craig I.W., Harrington H., McClay J., Mill J., Martin J., Braithwaite A., Poulton R. Influence of life stress on depression: Moderation by a polymorphism in the 5-HTT gene. Science. 2003;301:386–389. - PubMed
    1. Mackay T.F., Stone E.A., Ayroles J.F. The genetics of quantitative traits: Challenges and prospects. Nat. Rev. Genet. 2009;10:565–577. - PubMed

Publication types

Substances

Associated data