. 2010 Apr 25;400(1):115-27.
doi: 10.1016/j.virol.2010.01.027. Epub 2010 Feb 18.

Seoul virus suppresses NF-kappaB-mediated inflammatory responses of antigen presenting cells from Norway rats

Affiliations

Seoul virus suppresses NF-kappaB-mediated inflammatory responses of antigen presenting cells from Norway rats

Rebecca Y Au et al. Virology. .

Abstract

Hantavirus infection reduces antiviral defenses, increases regulatory responses, and causes persistent infection in rodent hosts. To address whether hantaviruses alter the maturation and functional activity of antigen presenting cells (APCs), rat bone marrow-derived dendritic cells (BMDCs) and macrophages (BMDMs) were generated and infected with Seoul virus (SEOV) or stimulated with TLR ligands. SEOV infected both DCs and macrophages, but copies of viral RNA, viral antigen, and infectious virus titers were higher in macrophages. The expression of MHCII and CD80, production of IL-6, IL-10, and TNF-alpha, and expression of Ifnbeta were attenuated in SEOV-infected APCs. Stimulation of APCs with poly I:C prior to SEOV infection increased the expression of activation markers and production of inflammatory cytokines and suppressed SEOV replication. Infection of APCs with SEOV suppressed LPS-induced activation and innate immune responses. Hantaviruses reduce the innate immune response potential of APCs derived from a natural host, which may influence persistence of these zoonotic viruses in the environment.


Conflict of interest statement

Disclosures: The authors have no financial conflict of interest.

Figures

Figure 1
Figure 1. TLR ligands induce inflammatory responses in DCs from Norway rats
BMDCs were cultured for 8 days and stimulated with LPS (1 μg/ml), poly I:C (1 μg/ml), or R837 (1 μg/ml) for the last 24 h of culture. A) Representative histograms of non-adherent cells harvested and stained for FACS analysis are shown. Gray line: isotype control; shaded histogram: untreated BMDCs; solid line: TLR-stimulated BMDCs. B) Values represent either the percentage of total cells (CD11c+) or the percentage of CD11c+ BMDCs expressing MHCII, CD80, and CD86 following stimulation with the indicated TLR ligands. C) Culture supernatants were collected after 24 h of stimulation with TLR ligands and analyzed for mean production of TNF-α, IL-6, IL-10, and TGF-β by ELISA. D) Expression of Ifnβ in BMDCs was measured at Day 8 by real-time RT-PCR and is normalized to Gapdh and the expression levels of the media control. Results are representative of 3 independent experiments. The vertical bars indicate means ±SEM and an asterisk (*) indicates that the TLR ligand enhances responses compared with media alone, P < 0.05.
Figure 2
Figure 2. TLR ligands induce inflammatory responses in macrophages from Norway rats
BMDMs were cultured for 8 days and stimulated with LPS (1 μg/ml), poly I:C (1 μg/ml), or R837 (1 μg/ml) for the last 24 h of culture. A) Representative histograms of adherent cells harvested and stained for FACS analysis are shown. Gray line: isotype control; shaded histogram: untreated BMDMs; solid line: TLR stimulated BMDMs. B) Values represent either the percentage of total cells (CD163+) or the percentage of CD163+ BMDMs expressing MHCII, CD80, and CD86 following stimulation with the indicated TLR ligands. C) Culture supernatants were collected after 24 h of stimulation with TLR ligands and examined for mean production of TNF-α, IL-6, IL-10, and TGF-β by ELISA. D) Expression of Ifnβ in BMDMs was measured at day 8 by real-time RT-PCR and is normalized to Gapdh and the expression levels of the media control. Results are representative of 3 independent experiments. The vertical bars indicate means ±SEM and an asterisk (*) indicates that the TLR ligand enhanced responses compared with media alone, p < 0.05.
Figure 3
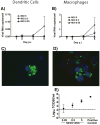
Figure 3. SEOV infection is more productive in macrophages than in DCs from Norway rats
After 7 days of differentiation, BMDCs and BMDMs were inoculated with media alone or media containing SEOV at a MOI of 0.05, 0.5, or 5. DCs (A) and macrophages (B) were collected 1, 2, 4, and 6 days p.i. and viral negative-sense RNA was measured by real-time RT-PCR. At 6 days p.i. cells infected with SEOV at a MOI of 5 were collected, fixed, and SEOV N protein (green) and nuclei (blue) was identified in BMDCs (C) and BMDMs (D) with anti-ANDV mAb and DAPI respectively. At 6 days p.i., supernatants were collected from BMDCs (data not shown) and BMDMs (E) infected with SEOV at a MOI of 5 and infectious virus titers were quantified using an immunoTCID50 assay. As a positive control, Vero E6 cells were infected with SEOV (MOI = 0.01), supernatants were collected, and infectious virus titers were quantified using a TCID50 assay. The dotted line represents the limit of detection for this assay. Results are representative of 3 independent experiments. The vertical bars indicate means ±SEM.
Figure 4
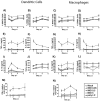
Figure 4. SEOV does not induce inflammatory or antiviral responses in DCs or macrophages from Norway rats
After 7 days of differentiation, BMDCs and BMDMs were inoculated with media alone or media containing SEOV at a MOI of 0.05, 0.5, or 5. At 1, 2, 4, and 6 days p.i., non-adherent DCs and adherent macrophages were harvested for FACS analysis. Values represent the percentage of CD11c+ BMDCs and CD163+ BMDMs expressing MHCII and CD80 following stimulation (A-D). Culture supernatants were collected 1, 2, 4, and 6 days p.i. and examined for mean production of TNF-α, IL-6, IL-10, and TGF-β by ELISA (E-L). Expression of Ifnβ in BMDCs and BMDMs was measured at the indicated times by real-time RT-PCR and is normalized to Gapdh and the expression levels of mock-infected cells (M and N). Results are representative of 3 independent experiments. The values indicate means ±SEM.
Figure 5
Figure 5. Pretreatment of DCs and macrophages with poly I:C reduces SEOV RNA loads
After 6 days of differentiation, BMDCs and BMDMs were treated with poly I:C (1 μg/ml) or media alone for 24 h and then inoculated with media alone or media containing SEOV at a MOI of 5. DCs (A) and macrophages (B) were collected 1, 2, 4, and 6 days p.i. and viral negative-sense RNA was measured by real-time RT-PCR. The vertical bars indicate means ±SEM. An asterisk (*) indicates that pretreatment of cells with poly I:C significantly reduced the number of SEOV RNA copies compared with cells infected with SEOV alone, P < 0.05.
Figure 6
Figure 6. Pretreatment of DCs and macrophages with poly I:C transiently increases inflammatory responses during SEOV infection
After 6 days of differentiation, BMDCs were stimulated with poly I:C (1 μg/ml) for 24 h. Cells were washed and inoculated with media alone or media containing SEOV (MOI of 5). A) At 1, 2, 4, and 6 days p.i., non-adherent DCs and adherent macrophages were harvested for FACS analysis and values represent the percentage of CD11c+ BMDCs and CD163+ BMDMs expressing MHCII and CD80 following SEOV infection (A-D). Culture supernatants were collected 1, 2, 4, and 6 days p.i. and used to quantify mean concentrations of TNF-α, IL-6, IL-10, and TGF-β by ELISA (E-L). Expression of Ifnβ in BMDCs and BMDMs was measured at the indicated times by real-time RT-PCR and is normalized to Gapdh and the expression levels of mock-infected cells (M and N). Results are representative of 2 independent experiments. The values indicate means ±SEM.
Figure 7
Figure 7. SEOV suppresses LPS-induced activation of DCs and macrophages
After 7 days of differentiation, BMDCs were inoculated with media alone or media containing SEOV (MOI of 5). Mock and SEOV-infected cells were stimulated with LPS (1 μg/ml) 24 h prior to harvesting cells. At 1, 2, 4, and 6 days p.i., non-adherent DCs and adherent macrophages were harvested for FACS analysis and values represent the percentage of CD11c+ BMDCs and CD163+ BMDMs expressing MHCII and CD80 following SEOV infection (A-D). Culture supernatants were collected at the indicated times and analyzed for mean production of TNF-α, IL-6, IL-10, and TGF-β by ELISA (E-L). Expression of Ifnβ in BMDCs and BMDMs was measured at 1, 2, 4, and 6 days p.i. by real-time RT-PCR and is normalized to Gapdh and the expression levels of mock-infected cells (M and N). Results are representative of 3 independent experiments. The values indicate means ±SEM.
Figure 8
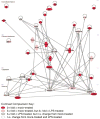
Figure 8. SEOV suppresses NF-κB signaling activity following stimulation of macrophages with LPS
The rat NF-κB signaling pathway RT2 Profiler PCR Array was used to examine the expression of 84 pathway-focused genes and the resulting gene expression values were analyzed by one-way ANOVA and only genes that demonstrated a > 2-fold change with P < 0.05 in the contrast comparison of expression values from experimental treatment cells and mock infected cells were considered differentially expressed. Represented in the custom pathway is the fold change in the expression of genes from BMDMs infected with SEOV and subsequently stimulated with LPS relative to either mock-treated or LPS-treated cells. The contrast comparisons were imported into IPA and clustered into functional groups based on biological function to create a network of genes that are associated with NF-κB-mediated inflammatory responses and that are differentially expressed following SEOV infection. Gray lines indicate direct relationships between genes. See Supplemental Table 1 for the complete list of genes and fold change values.

Similar articles

Cited by

References

    1. Alff PJ, Sen N, Gorbunova E, Gavrilovskaya IN, Mackow ER. The NY-1 hantavirus Gn cytoplasmic tail coprecipitates TRAF3 and inhibits cellular interferon responses by disrupting TBK1-TRAF3 complex formation. J Virol. 2008;82:9115–9122. - PMC - PubMed
    1. Arai S, Ohdachi SD, Asakawa M, Kang HJ, Mocz G, Arikawa J, Okabe N, Yanagihara R. Molecular phylogeny of a newfound hantavirus in the Japanese shrew mole (Urotrichus talpoides) Proc Natl Acad Sci U S A. 2008;105:16296–16301. - PMC - PubMed
    1. Beck K, Meyer-Konig U, Weidmann M, Nern C, Hufert FT. Human cytomegalovirus impairs dendritic cell function: a novel mechanism of human cytomegalovirus immune escape. Eur J Immunol. 2003;33:1528–1538. - PubMed
    1. Boltz-Nitulescu G, Wiltschke C, Holzinger C, Fellinger A, Scheiner O, Gessl A, Forster O. Differentiation of rat bone marrow cells into macrophages under the influence of mouse L929 cell supernatant. J Leukoc Biol. 1987;41:83–91. - PubMed
    1. Botten J, Mirowsky K, Kusewitt D, Ye C, Gottlieb K, Prescott J, Hjelle B. Persistent Sin Nombre virus infection in the deer mouse (Peromyscus maniculatus) model: sites of replication and strand-specific expression. J Virol. 2003;77:1540–1550. - PMC - PubMed

Publication types

MeSH terms