Racial and social class gradients in life expectancy in contemporary California
- PMID: 20171001
- PMCID: PMC2849870
- DOI: 10.1016/j.socscimed.2010.01.003
Racial and social class gradients in life expectancy in contemporary California
Abstract
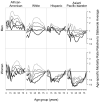
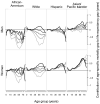
Life expectancy, or the estimated average age of death, is among the most basic measures of a population's health. However, monitoring differences in life expectancy among sociodemographically defined populations has been challenging, at least in the United States (US), because death certification does not include collection of markers of socioeconomic status (SES). In order to understand how SES and race/ethnicity independently and jointly affected overall health in a contemporary US population, we assigned a small-area-based measure of SES to all 689,036 deaths occurring in California during a three-year period (1999-2001) overlapping the most recent US census. Residence at death was geocoded to the smallest census area available (block group) and assigned to a quintile of a multifactorial SES index. We constructed life tables using mortality rates calculated by age, sex, race/ethnicity and neighborhood SES quintile, and produced corresponding life expectancy estimates. We found a 19.6 (+/-0.6) year gap in life expectancy between the sociodemographic groups with the longest life expectancy (highest SES quintile of Asian females; 84.9 years) and the shortest (lowest SES quintile of African-American males; 65.3 years). A positive SES gradient in life expectancy was observed among whites and African-Americans but not Hispanics or Asians. Age-specific mortality disparities varied among groups. Race/ethnicity and neighborhood SES had substantial and independent influences on life expectancy, underscoring the importance of monitoring health outcomes simultaneously by these factors. African-American males living in the poorest 20% of California neighborhoods had life expectancy comparable to that reported for males living in developing countries. Neighborhood SES represents a readily-available metric for ongoing surveillance of health disparities in the US.
Copyright 2010 Elsevier Ltd. All rights reserved.
Figures


Similar articles
-
Ten Americas: a systematic analysis of life expectancy disparities in the USA.Lancet. 2024 Dec 7;404(10469):2299-2313. doi: 10.1016/S0140-6736(24)01495-8. Epub 2024 Nov 21. Lancet. 2024. PMID: 39581204 Free PMC article.
-
Socioeconomic status and prostate cancer incidence and mortality rates among the diverse population of California.Cancer Causes Control. 2009 Oct;20(8):1431-40. doi: 10.1007/s10552-009-9369-0. Epub 2009 Jun 13. Cancer Causes Control. 2009. PMID: 19526319 Free PMC article.
-
Disparities in wellbeing in the USA by race and ethnicity, age, sex, and location, 2008-21: an analysis using the Human Development Index.Lancet. 2024 Dec 7;404(10469):2261-2277. doi: 10.1016/S0140-6736(24)01757-4. Epub 2024 Nov 7. Lancet. 2024. PMID: 39522526
-
Folic acid supplementation and malaria susceptibility and severity among people taking antifolate antimalarial drugs in endemic areas.Cochrane Database Syst Rev. 2022 Feb 1;2(2022):CD014217. doi: 10.1002/14651858.CD014217. Cochrane Database Syst Rev. 2022. PMID: 36321557 Free PMC article.
-
Areas of disadvantage: a systematic review of effects of area-level socioeconomic status on substance use outcomes.Drug Alcohol Rev. 2011 Jan;30(1):84-95. doi: 10.1111/j.1465-3362.2010.00191.x. Drug Alcohol Rev. 2011. PMID: 21219502 Free PMC article.
Cited by
-
Sub-County Life Expectancy: A Tool to Improve Community Health and Advance Health Equity.Prev Chronic Dis. 2018 Jan 25;15:E11. doi: 10.5888/pcd15.170187. Prev Chronic Dis. 2018. PMID: 29369759 Free PMC article.
-
Analyzing Associations Between Chronic Disease Prevalence and Neighborhood Quality Through Google Street View Images.IEEE Access. 2020;8:6407-6416. doi: 10.1109/access.2019.2960010. Epub 2019 Dec 16. IEEE Access. 2020. PMID: 33777591 Free PMC article.
-
Using Google Street View to examine associations between built environment characteristics and U.S. health outcomes.Prev Med Rep. 2019 Apr 9;14:100859. doi: 10.1016/j.pmedr.2019.100859. eCollection 2019 Jun. Prev Med Rep. 2019. PMID: 31061781 Free PMC article.
-
The California Neighborhoods Data System: a new resource for examining the impact of neighborhood characteristics on cancer incidence and outcomes in populations.Cancer Causes Control. 2011 Apr;22(4):631-47. doi: 10.1007/s10552-011-9736-5. Epub 2011 Feb 12. Cancer Causes Control. 2011. PMID: 21318584 Free PMC article.
-
Intersection of Race/Ethnicity and Socioeconomic Status in Mortality After Breast Cancer.J Community Health. 2015 Dec;40(6):1287-99. doi: 10.1007/s10900-015-0052-y. J Community Health. 2015. PMID: 26072260 Free PMC article.
References
-
- Arriaga EE. Measuring and explaining the change in life expectancies. Demography. 1984;21(1):83–96. - PubMed
-
- Berkman LF, Macintyre S. The measurement of social class in health studies: old measures and new formulations. In: Kogevinas M, Pearce N, Susser M, Boffetta P, editors. Social Inequalities and Cancer. International Agency for Research on Cancer; Lyon: 1997. pp. 51–64. - PubMed
-
- Clarke CA, Glaser SL, Keegan TH, Stroup A. Neighborhood socioeconomic status and Hodgkin's lymphoma incidence in California. Cancer Epidemiol Biomarkers Prev. 2005;14(6):1441–1447. - PubMed
-
- Deming WE, Stephan FF. On a Least Squares Adjustment of a Sampled Frequency Table When the Expected Marginal Totals are Known. The Annals of Mathematical Statistics. 1940;11(4):427–444.
Publication types
MeSH terms
Grants and funding
LinkOut - more resources
Full Text Sources
Medical
Miscellaneous

