

On the growth and internal structure of the human lens
- PMID: 20171212
- PMCID: PMC2871961
- DOI: 10.1016/j.exer.2010.01.013
On the growth and internal structure of the human lens
Abstract
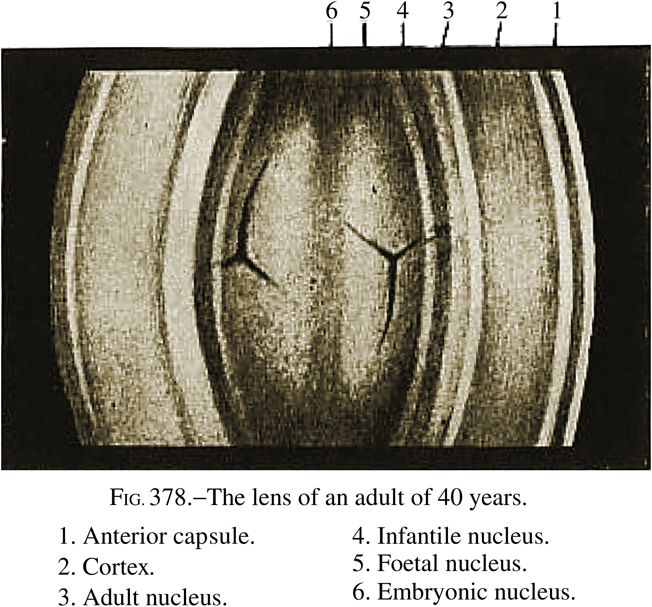
Growth of the human lens and the development of its internal features are examined using in vivo and in vitro observations on dimensions, weights, cell sizes, protein gradients and other properties. In vitro studies have shown that human lens growth is biphasic, asymptotic until just after birth and linear for most of postnatal life. This generates two distinct compartments, the prenatal and the postnatal. The prenatal growth mode leads to the formation of an adult nuclear core of fixed dimensions and the postnatal, to an ever-expanding cortex. The nuclear core and the cortex have different properties and can readily be physically separated. Communication and adhesion between the compartments is poor in older lenses. In vivo slit lamp examination reveals several zones of optical discontinuity in the lens. Different nomenclatures have been used to describe these, with the most common recognizing the embryonic, foetal, juvenile and adult nuclei as well as the cortex and outer cortex. Implicit in this nomenclature is the idea that the nuclear zones were generated at defined periods of development and growth. This review examines the relationship between the two compartments observed in vitro and the internal structures revealed by slit lamp photography. Defining the relationship is not as simple as it might seem because of remodeling and cell compaction which take place, mostly in the first 20 years of postnatal life. In addition, different investigators use different nomenclatures when describing the same regions of the lens. From a consideration of the dimensions, the dry mass contents and the protein distributions in the lens and in the various zones, it can be concluded that the juvenile nucleus and the layers contained within it, as well as most of the adult nucleus, were actually produced during prenatal life and the adult nucleus was completed within 3 months after birth, in the final stages of the prenatal growth mode. Further postnatal growth takes place entirely within the cortex. It can also be demonstrated that the in vitro nuclear core corresponds to the combined slit lamp nuclear zones. In view of the information presented in this review, the use of the terms foetal, juvenile and adult nucleus seems inappropriate and should be abandoned.
Copyright 2010 Elsevier Ltd. All rights reserved.
Figures
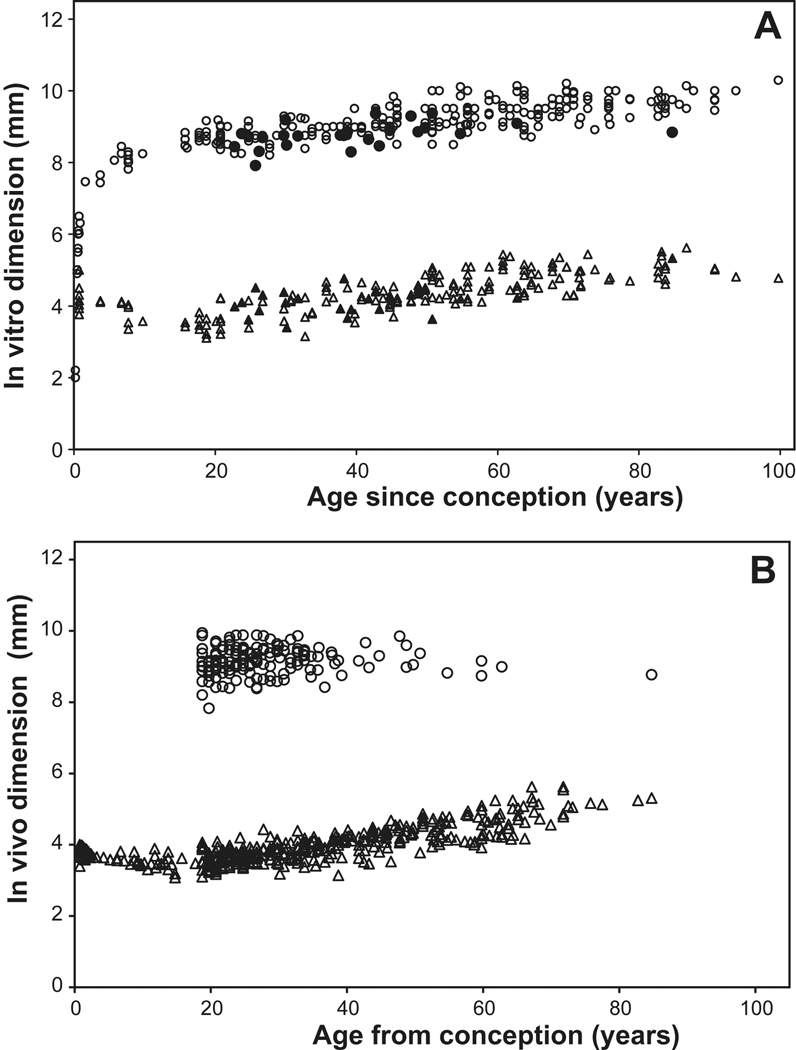
 ) and equatorial diameter (
 ) as a function of age. The fully accommodated in vivo dimensions of Strenk et al (1999) are included in Figure 2A as solid symbols. Data were obtained from the studies of Augusteyn (unpublished), Ehlers et al (1968), Jones et al (2007), Rosen et al (2006), Schachar 2006, Smith (1883), Strenk et al (1999), Uhlhorn et al (2008), Weekers et al (1973).
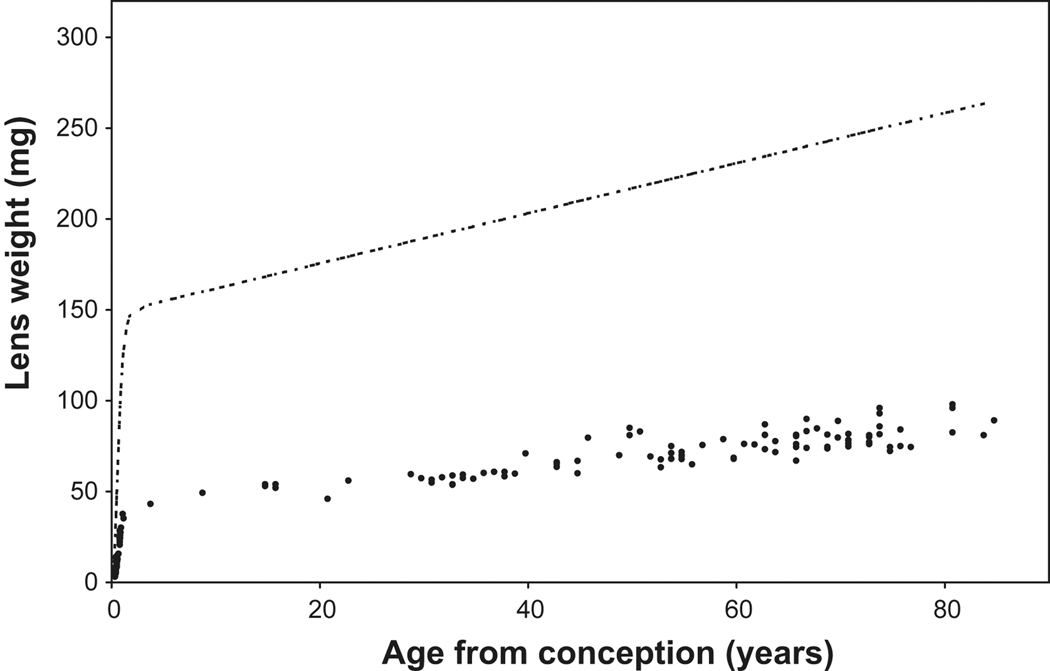
 ) and fixed dry weight (
 ) as a function of age since conception. The wet weight line is derived from the relationship, Lens WW = 1.38Ab+149e^[e^(1.6–3Ac)], where Ab is postnatal age in years, Ac is the time in years since conception and lens weight is in milligrams (Augusteyn 2007). The fixed dry weights are actual data available late in 2009 (Augusteyn, unpublished; Bours et al 1986; Clapp, 1913; Nordman et al 1974). The data from lenses over 20 years old fit on the straight line, Dry wt = 41 + 0.55*Ab. Inset: An expanded view of the dry weight data for the first 10 years. It should be noted that fixation increases the dry weight by 5–10% relative to the weights obtained by lyophilization or thermogravimetric analysis. Thus a lens with a dry mass of 30 mg could have a fixed dry weight of up to 33 mg.
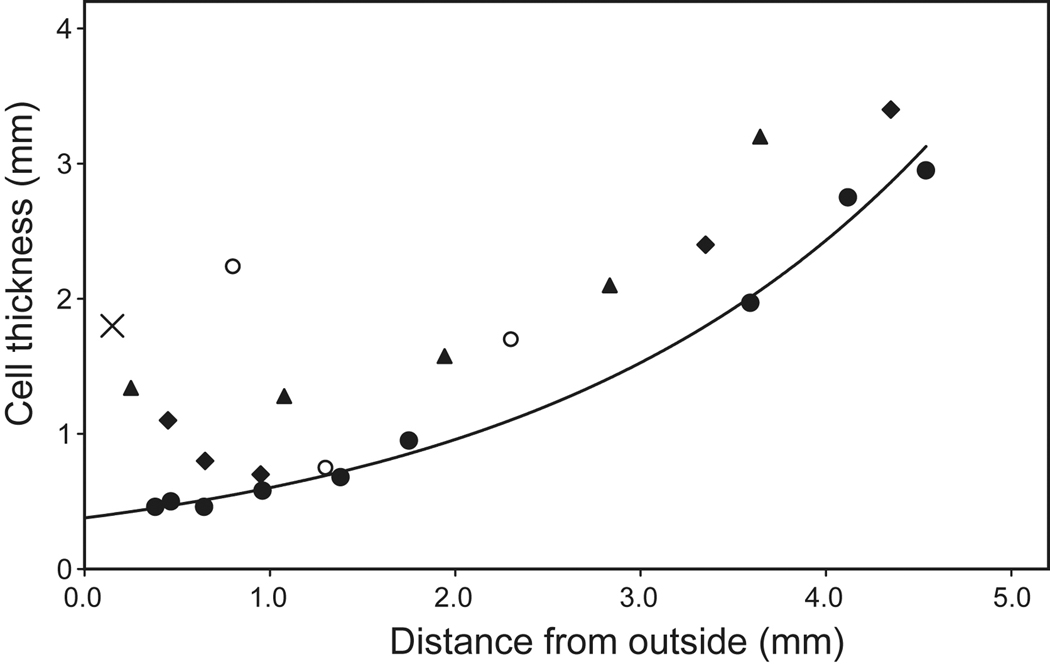
 ) (Al-Ghoul et al 2001; Gilliland et al 2009), 66 (
 ) (Gilliland et al 2009) and 61 years (
 ) (Taylor et al, 1996) and from confocal microscopy of a 16 year old lens (
 , Lim et al 2009). The outermost point in each data set probably represents a region 0.3–0.4 mm from the capsule but may be further in. The single point at 0.15 mm (X) represents the thickness of newly formed fibre cells near the capsule of a 44 yo lens (Gilliland et al 2009). The approximate locations of the regions named the foetal (
 ) and juvenile (
 ) nuclei are indicated.
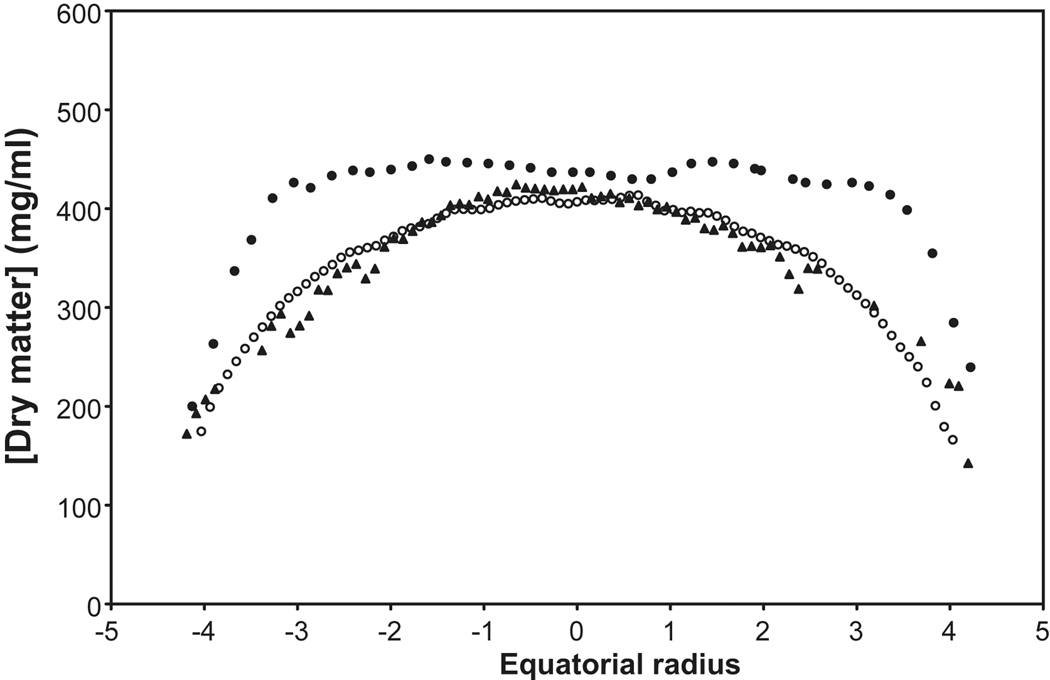
 , 27yo; Fagerholm et al, 1981), calculated from the measured refractive index (
 ; 28 yo; Augusteyn et al 2008) and from the speed of sound (
 ; 27 yo; R. Urs, 2009, personal communication). For the ultrasound calculations, a constant of 3.9 was employed, rather than the 3.2 deduced by Goss et al (1980). The microradiography distributions are sagittal data, scaled to the equatorial size. Compaction changes are more rapid in the sagittal plane than in the equatorial (Augusteyn et al 2008) so the extrapolated protein plateau size is likely to be overestimated.
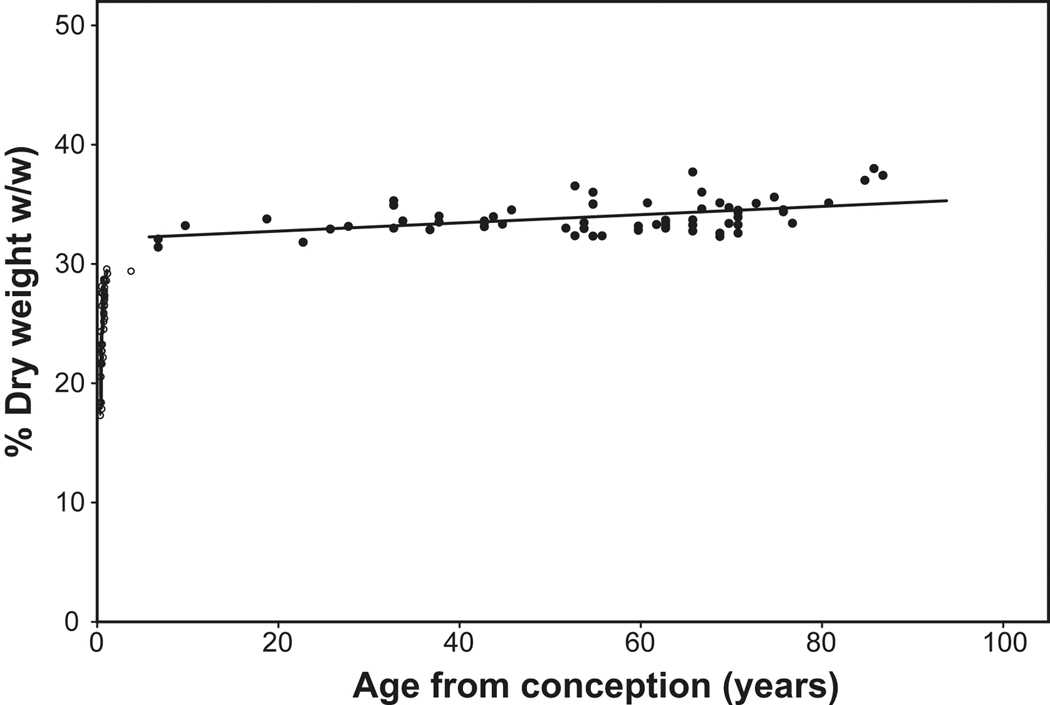
References
-
- Al-Ghoul KJ, Nordgren RK, Kuszak AJ, Freel CD, Costello MJ, Kuszak JR. Structural evidence of human nuclear fiber compaction as a function of ageing and cataractogenesis. Exp. Eye Res. 2001;72:199–214. - PubMed
-
- Atchison DA, Markwell EL, Kasthurirangan S, Pope JM, Smith G, Swann P. Age-related changes in optical and biometric characteristics of emmetropic eyes. J. Vision 8. 2008;29:1–20. - PubMed
-
- Augusteyn RC. Growth of the lens: in vitro observations. Clin. Exp. Optom. 2008;91:226–239. - PubMed
-
- Augusteyn RC, Cake MA. Post mortem uptake of water by sheep lenses left in the eye. Mol. Vis. 2005;11:749–751. - PubMed
Publication types
MeSH terms
Substances
Grants and funding
LinkOut - more resources
Full Text Sources
