

Voxelwise genome-wide association study (vGWAS)
- PMID: 20171287
- PMCID: PMC2900429
- DOI: 10.1016/j.neuroimage.2010.02.032
Voxelwise genome-wide association study (vGWAS)
Abstract
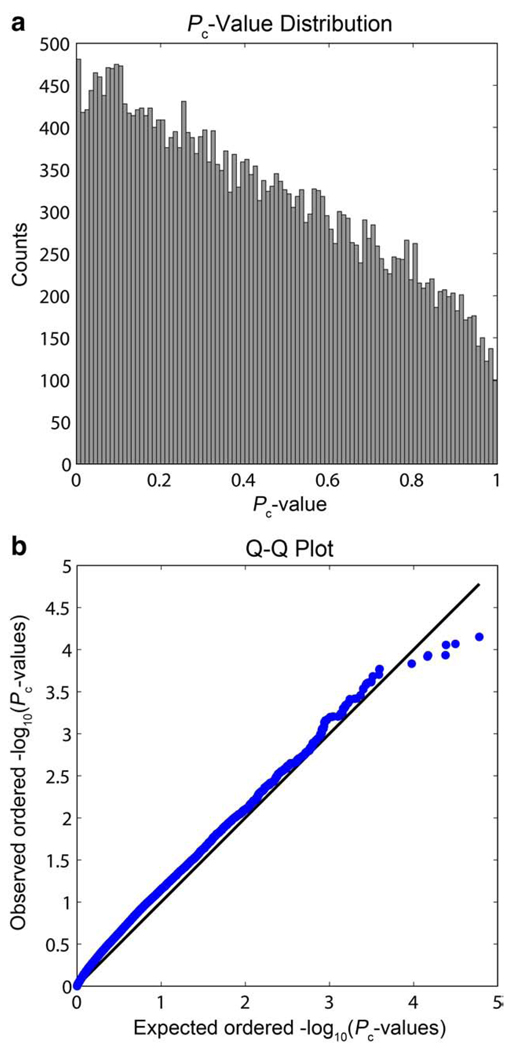
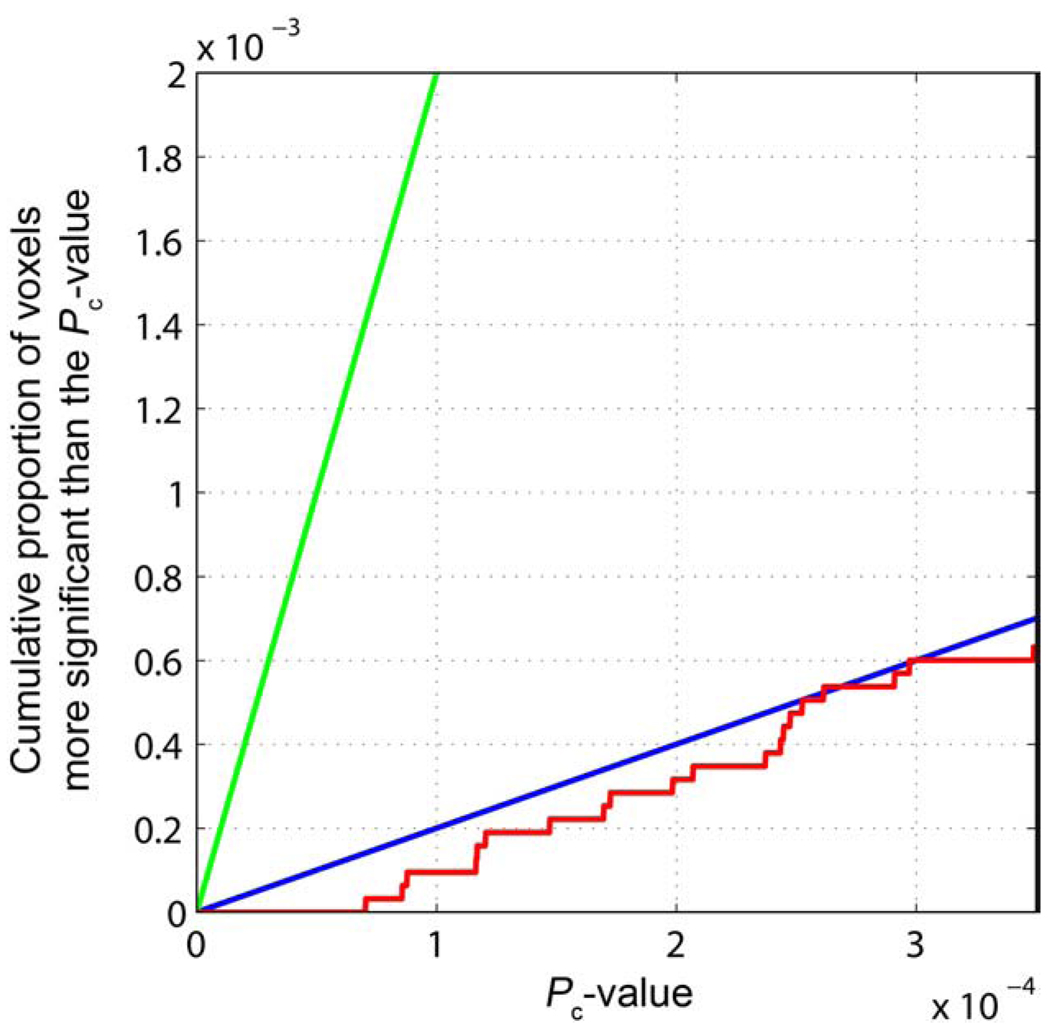
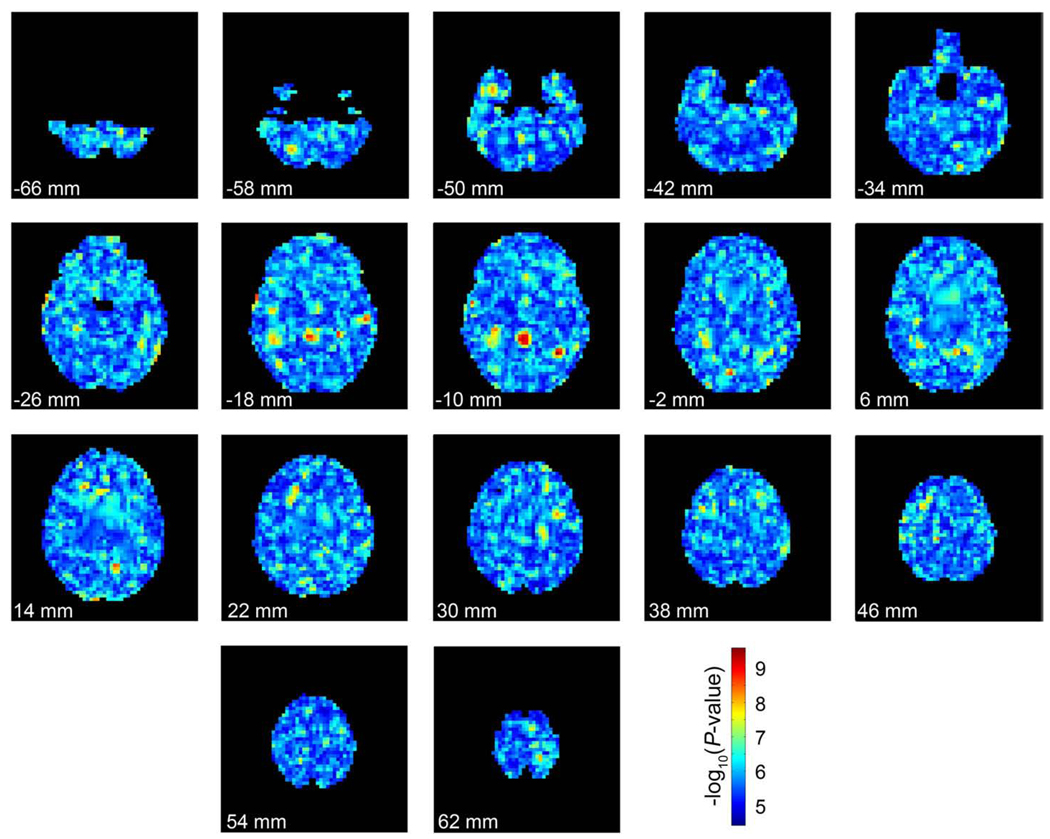
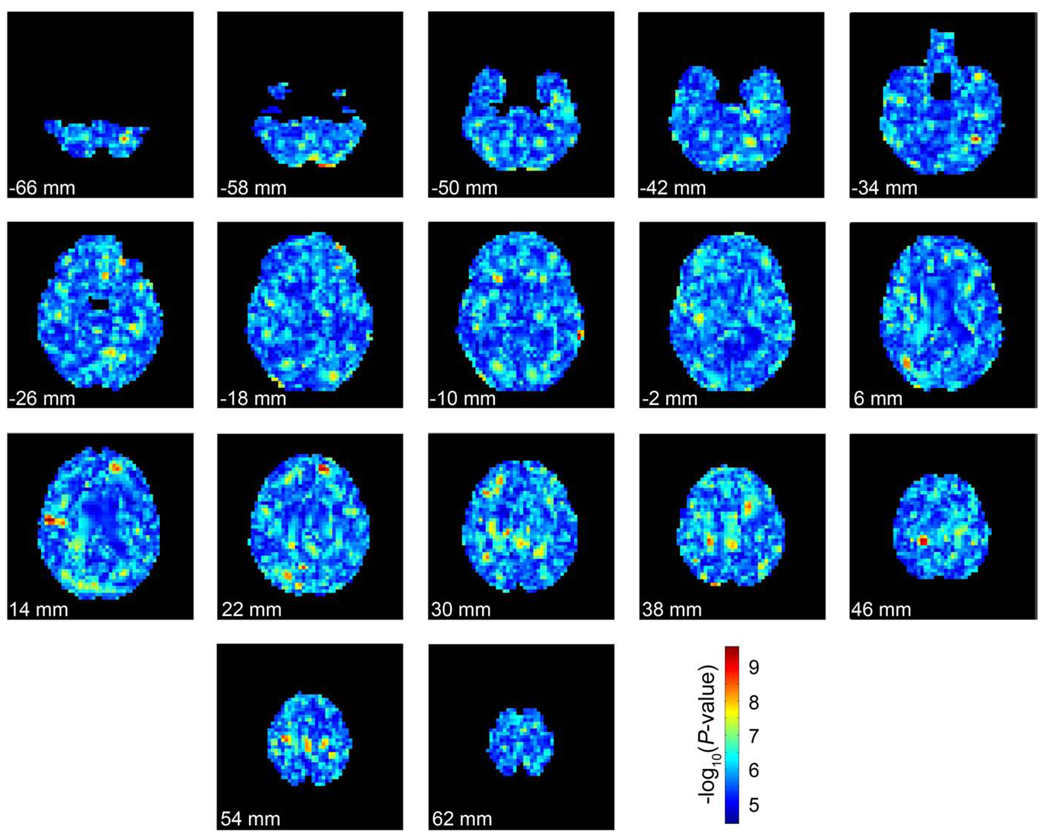
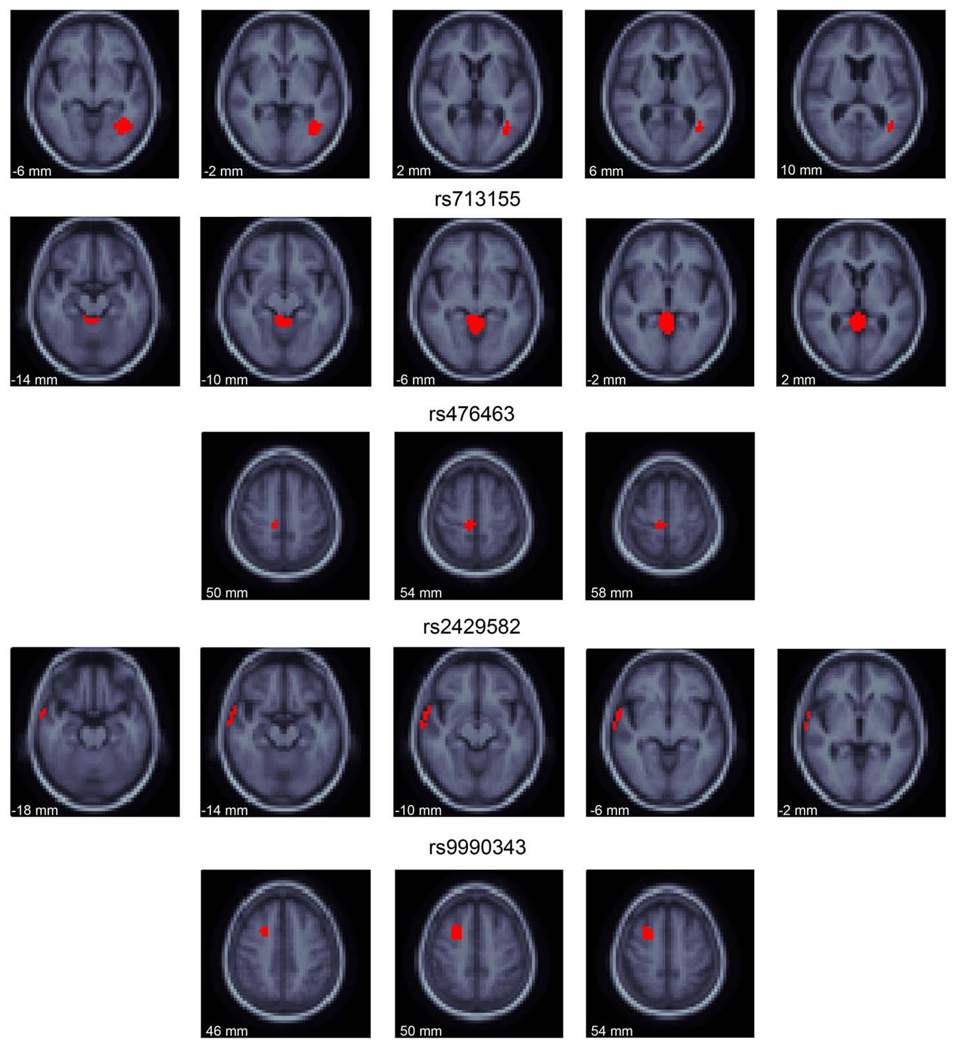
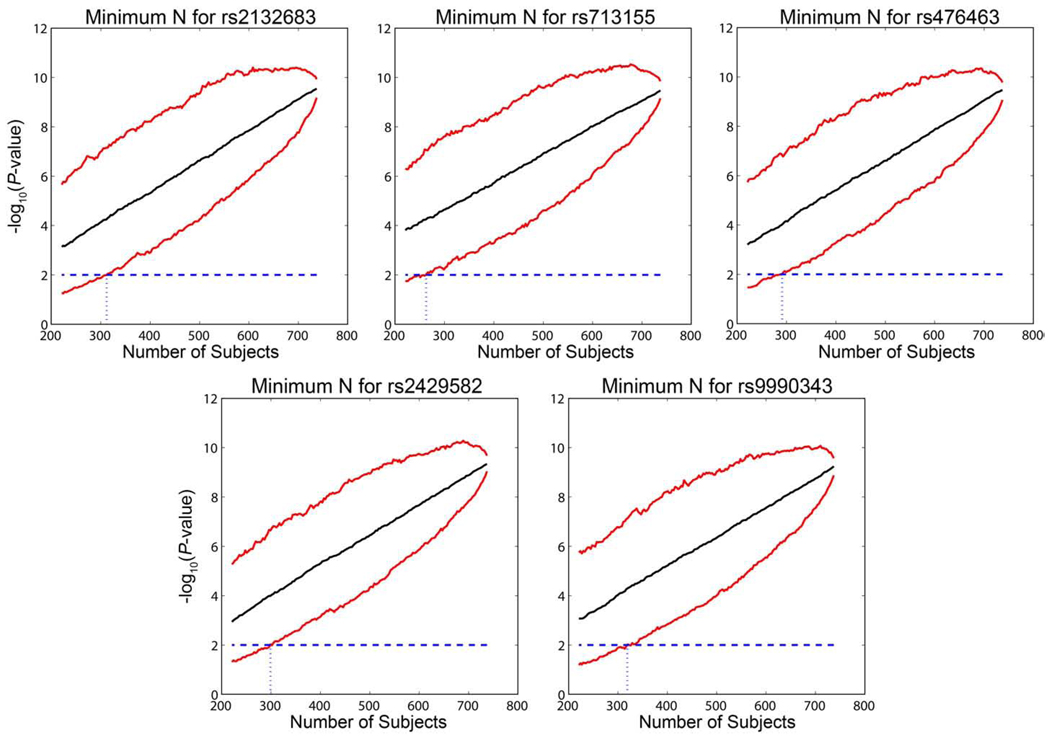
The structure of the human brain is highly heritable, and is thought to be influenced by many common genetic variants, many of which are currently unknown. Recent advances in neuroimaging and genetics have allowed collection of both highly detailed structural brain scans and genome-wide genotype information. This wealth of information presents a new opportunity to find the genes influencing brain structure. Here we explore the relation between 448,293 single nucleotide polymorphisms in each of 31,622 voxels of the entire brain across 740 elderly subjects (mean age+/-s.d.: 75.52+/-6.82 years; 438 male) including subjects with Alzheimer's disease, Mild Cognitive Impairment, and healthy elderly controls from the Alzheimer's Disease Neuroimaging Initiative (ADNI). We used tensor-based morphometry to measure individual differences in brain structure at the voxel level relative to a study-specific template based on healthy elderly subjects. We then conducted a genome-wide association at each voxel to identify genetic variants of interest. By studying only the most associated variant at each voxel, we developed a novel method to address the multiple comparisons problem and computational burden associated with the unprecedented amount of data. No variant survived the strict significance criterion, but several genes worthy of further exploration were identified, including CSMD2 and CADPS2. These genes have high relevance to brain structure. This is the first voxelwise genome wide association study to our knowledge, and offers a novel method to discover genetic influences on brain structure.
Copyright 2010 Elsevier Inc. All rights reserved.
Figures

References
-
- Bartholomeusz G, Wu Y, Ali Seyed M, Xia W, Kwong KY, Hortobagyi G, Hung MC. Nuclear translocation of the pro-apoptotic Bcl-2 family member Bok induces apoptosis. Mol.Carcinog. 2006;45(2):73–83. - PubMed
-
- Bearden CE, Thompson PM, Dalwani M, Hayashi KM, Lee AD, Nicoletti M, Trakhtenbroit M, Glahn DC, Brambilla P, Sassi RB, Mallinger AG, Frank E, Kupfer DJ, Soares JC. Greater cortical gray matter density in lithium-treated patients with bipolar disorder. Biol. Psychiatry. 2007;62(1):7–16. - PMC - PubMed
-
- Bearden CE, Thompson PM, Dutton RA, Frey BN, Peluso MA, Nicoletti M, Dierschke N, Hayashi KM, Klunder AD, Glahn DC, Brambilla P, Sassi RB, Mallinger AG, Soares JC. Three-dimensional mapping of hippocampal anatomy in unmedicated and lithium-treated patients with bipolar disorder. Neuropsychopharmacology. 2008;33(6):1229–1238. - PMC - PubMed
-
- Benjamini Y, Hochberg Y. Controlling the false discovery rate—a practical and powerful approach to multiple testing. J. R. Stat Soc, Ser. B Methodol. 1995;57(1):289–300.
-
- Benjamini Y, Yekutieli D. The control of the false discovery rate in multiple testing under dependency. Ann. Stat. 2001;29(4):1165–1188.
Publication types
MeSH terms
Grants and funding
- R01 EB007813/EB/NIBIB NIH HHS/United States
- U24 AG021886/AG/NIA NIH HHS/United States
- 1-T90-DA022768:02/DA/NIDA NIH HHS/United States
- R01 AG020098/AG/NIA NIH HHS/United States
- P30 AG019610/AG/NIA NIH HHS/United States
- R01 EB008281/EB/NIBIB NIH HHS/United States
- U01 AG024904/AG/NIA NIH HHS/United States
- U19 AG010483/AG/NIA NIH HHS/United States
- M01 RR000865/RR/NCRR NIH HHS/United States
- R01 AG012101/AG/NIA NIH HHS/United States
- F31 MH087061/MH/NIMH NIH HHS/United States
- R01 HD050735/HD/NICHD NIH HHS/United States
- 1F31MH087061/MH/NIMH NIH HHS/United States
- R01 EB008432/EB/NIBIB NIH HHS/United States
- M01RR000865/RR/NCRR NIH HHS/United States
- R01HD050735/HD/NICHD NIH HHS/United States
- P41 RR013642/RR/NCRR NIH HHS/United States
- R01-NS059873/NS/NINDS NIH HHS/United States
- R01EB007813/EB/NIBIB NIH HHS/United States
- U54 RR021813/RR/NCRR NIH HHS/United States
- R01 NS059873/NS/NINDS NIH HHS/United States
- T90 DA022768/DA/NIDA NIH HHS/United States
LinkOut - more resources
Full Text Sources
