

Radiation dose-volume effects and the penile bulb
- PMID: 20171507
- PMCID: PMC4786051
- DOI: 10.1016/j.ijrobp.2009.04.094
Radiation dose-volume effects and the penile bulb
Abstract
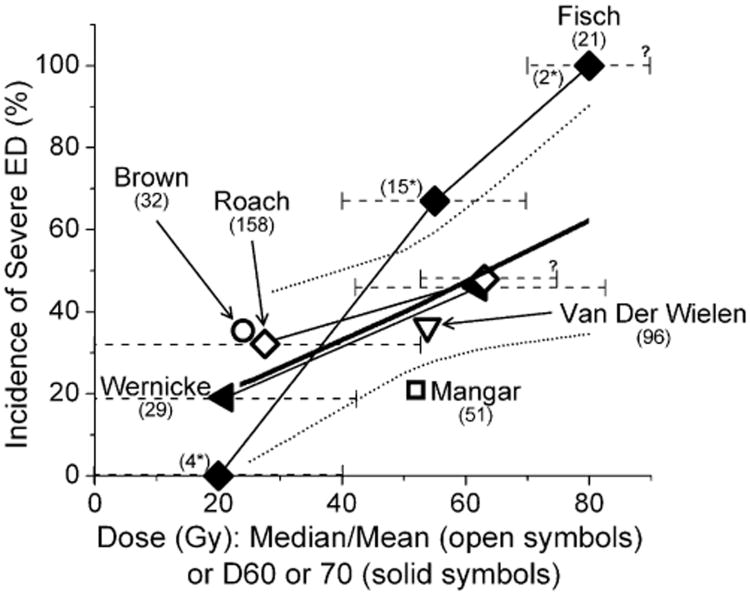
The dose, volume, and clinical outcome data for penile bulb are reviewed for patients treated with external-beam radiotherapy. Most, but not all, studies find an association between impotence and dosimetric parameters (e.g., threshold doses) and clinical factors (e.g., age, comorbid diseases). According to the data available, it is prudent to keep the mean dose to 95% of the penile bulb volume to <50 Gy. It may also be prudent to limit the D70 and D90 to 70 Gy and 50 Gy, respectively, but coverage of the planning target volume should not be compromised. It is acknowledged that the penile bulb may not be the critical component of the erectile apparatus, but it seems to be a surrogate for yet to be determined structure(s) critical for erectile function for at least some techniques.
Copyright 2010 Elsevier Inc. All rights reserved.
Conflict of interest statement
Conflict of interest: All other authors have no conflict of interest.
Figures

References
-
- Sanda MG, Dunn RL, Michalski J, et al. Quality of life and satisfaction with outcome among prostate-cancer survivors. N Engl J Med. 2008;358:1250–1261. - PubMed
-
- Robinson JW, Moritz S, Fung T. Meta-analysis of rates of erectile function after treatment of localized prostate carcinoma. Int J Radiat Oncol Biol Phys. 2002;54:1063–1068. - PubMed
-
- Rosen RC, Riley A, Wagner G, et al. The international index of erectile function (IIEF): A multidimensional scale for assessment of erectile dysfunction. Urology. 1997;49:822–830. - PubMed
-
- Broderick GA. Evidence based assessment of erectile dysfunction. Int J Impot Res. 1998;10(Suppl. 2):S64–S73. discussion S77–S69. - PubMed
-
- Brown MW, Brooks JP, Albert PS, et al. An analysis of erectile function after intensity modulated radiation therapy for localized prostate carcinoma. Prostate Cancer Prostatic Dis. 2007;10:189–193. - PubMed
Publication types
MeSH terms
Grants and funding
LinkOut - more resources
Full Text Sources
Medical
