

Review
doi: 10.1016/j.ijrobp.2009.06.091.
Radiation dose-volume effects in the lung
Affiliations
- PMID: 20171521
- PMCID: PMC3576042
- DOI: 10.1016/j.ijrobp.2009.06.091
Item in Clipboard
Review
Radiation dose-volume effects in the lung
Int J Radiat Oncol Biol Phys.
.
Abstract
The three-dimensional dose, volume, and outcome data for lung are reviewed in detail. The rate of symptomatic pneumonitis is related to many dosimetric parameters, and there are no evident threshold "tolerance dose-volume" levels. There are strong volume and fractionation effects.
Copyright 2010 Elsevier Inc. All rights reserved.
Conflict of interest statement
Figures
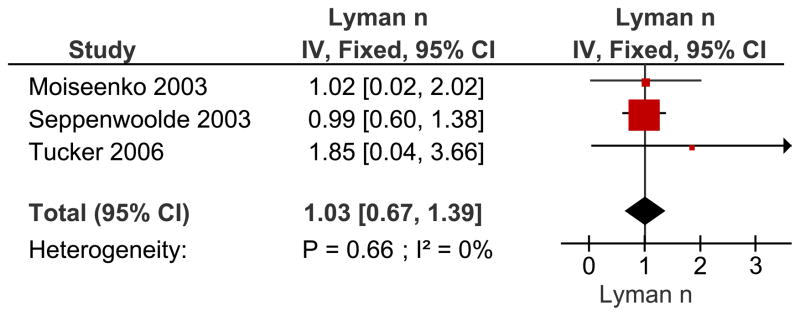
Meta-analysis of reported n-values (volume parameter) for the LKB model using an inverse-variance (IV) weighting method. Recovery of variance estimates from the 95% confidence intervals (CI) and use of ~± 2*sigma instead of 1.96*sigma gave rise to small deviations in the derived 95% CI as compared to the literature reported values. Data estimated from (, –41). Abbreviations: n = n-values for the LKB Model, IV = inverse variance, Fixed = fixed effect model CI = confidence interval. The n value reflects the manner in which dose/volume parameters lead to complications. A lower value of n suggests that the tissue is sensitive to hot spots (e.g., an organ structured in “series”), while a higher value of n (closer to 1.0), suggests that the risk is more related to the volume of an organ irradiated (e.g., “parallel” structure).
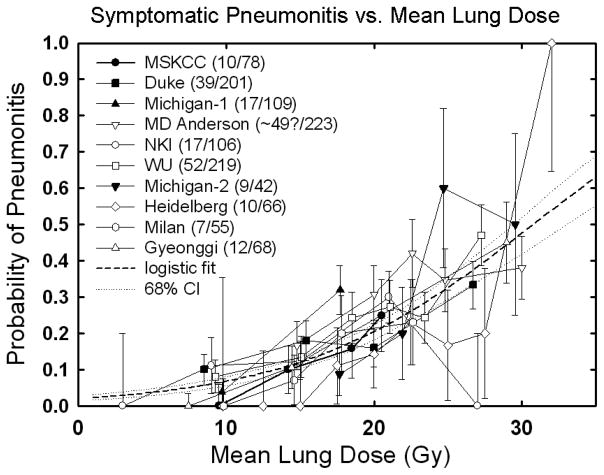
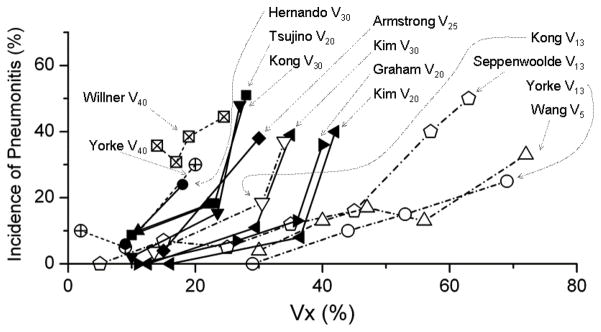
Rate of RP following fractionated partial lung RT related to: Panel A : Mean lung dose. Confidence intervals shown are ±1 standard deviation. .Mean dose response data from : MSKCC, (10) from Fig 4a; (≥RTOG grade 3, 6 months); Duke, (15) from Table 4; (≥CTC grade 1, 6 months); Michigan, (43) from Table 4 and Fig 2a; (≥SWOG grade 2, 6 months)—bin location and time from authors; MD Anderson, (44) from Fig 2; (≥CTC grade 3, 1 year actuarial—includes concurrent chemo patients); NKI, (9) from Fig 3a; (≥SWOG grade 2, 6 months); Washington University, (11) from Fig 9c; (≥SWOG grade 2—no time limit) with bin locations from authors, increased by 11% to ~account for inhomogeneity corrections; Michigan, (45) from Table 1; (≥SWOG grade 1) with mean doses calculated from relationship between EUD (n=0.87) and mean dose from Kwa et al. (42), Fig 2a); Heidelberg, (46) from Fig 2 and text (≥RTOG acute grade 1); Milan, (47) from Fig 3; (≥SWOG Grade 2—no time limit, patients without COPD – includes induction chemo patients); Gyeonggi, (48) from Table 5; (≥RTOG grade 3, 6 months—includes concurrent chemo patients)—median values of mean dose in each bin provided by the authors. Dashed line is logistic fit: data fit to the form (f/(1+f)), where f=exp(b0+b1*dmean). Best fit values [95% confidence intervals] are b0 = −3.87 [−3.33–−4.49], b1 = 0.126 [0.100–0.153], corresponding to TD50 = 30.75 [28.7–33.9] Gy and γ50 = 0.969 [0.833–1.122], where γ50 represents the increase in response [measured in %] per 1% increase in dose, near the 50% dose response level. Panel B : The rate of RP is shown for different values of Vx. Vx
response data from : Yorke V13, V40, (10) from Fig 4d; Willner V40, (68) from Fig 4; Hernando V30, (15) from Table 6; Tsujino V20, (56) from Fig 1; Kong V13, V20, (43), from Table 4; Armstrong V25, (59) Fig 3; Kim V20, V30, (69) from Table 5; Graham V20, (7) from Table 4; Seppenwoolde V13, (40) from Fig 2; Wang V5, (44). Some data estimated from published reports.
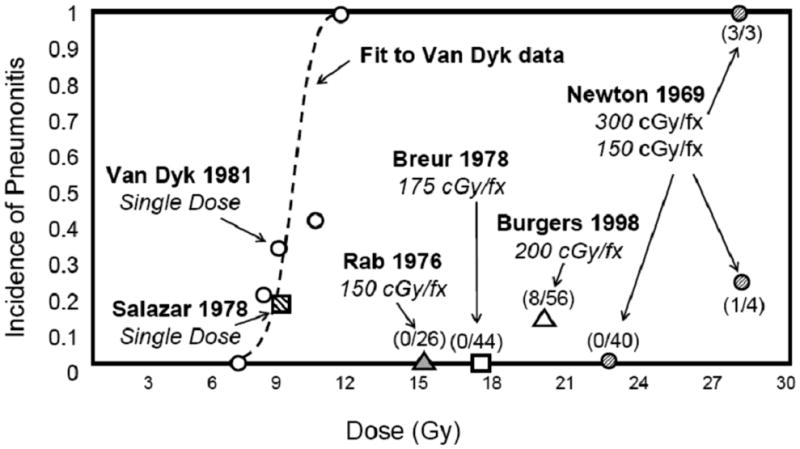
Whole lung irradiation for diffuse lung or boney metastases, or prophylaxis for occult metastatic disease (, –63). Numbers in parentheses give the incidence of pneumonitis divided by the population at risk for each fractionation scheme in each study. Some data estimated from published reports.
References
-
- Mehta V. Radiation pneumonitis and pulmonary fibrosis in non-small-cell lung cancer: Pulmonary function, prediction, and prevention. Int J Radiat Oncol Biol Phys. 2005;63:5–24. - PubMed
-
- Marks LB, Yu X, Vujaskovic Z, et al. Radiation-induced lung injury. Semin in Radiother Oncol. 2003;13:333–345. - PubMed
-
- Kocak Z, Evans ES, Zhou S-M, et al. Challenges in defining radiation pneumonitis in patients with lung cancer. Int J Radiat Oncol Biol Phys. 2005;62:635–638. - PubMed
-
- Marks LB, Hollis D, Munley M, et al. The role of lung perfusion imaging in predicting the direction of radiation-induced changes in pulmonary function tests. Cancer. 2000;88:2135–2141. - PubMed
-
- Kwa SL, Lebesque JV, Theuws JC, et al. Radiation pneumonitis as a function of mean lung dose: an analysis of pooled data of 540 patients. Int J Radiat Oncol Biol Phys. 1998;42:1–9. - PubMed
Publication types
MeSH terms
Grants and funding
LinkOut - more resources
Full Text Sources
Other Literature Sources
Medical
