. 2010 Mar;4(2):117-28.
doi: 10.1016/j.scr.2009.12.002. Epub 2010 Jan 4.

Rapid and dynamic alterations of gene expression profiles of adult porcine bone marrow-derived stem cell in response to hypoxia

Affiliations

Rapid and dynamic alterations of gene expression profiles of adult porcine bone marrow-derived stem cell in response to hypoxia

Suna Wang et al. Stem Cell Res. 2010 Mar.

Abstract

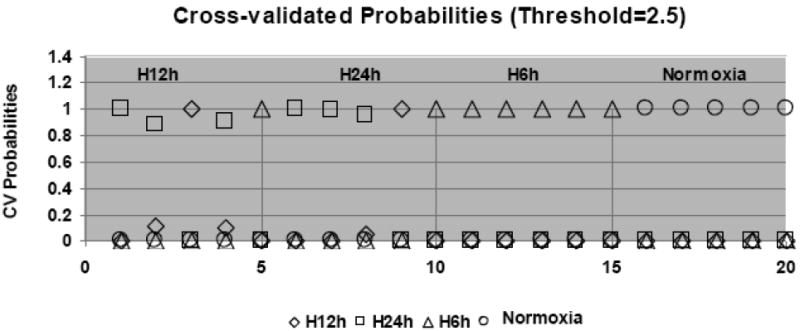
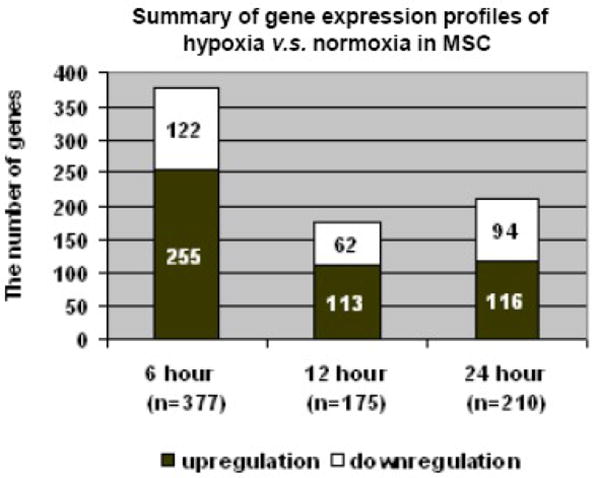
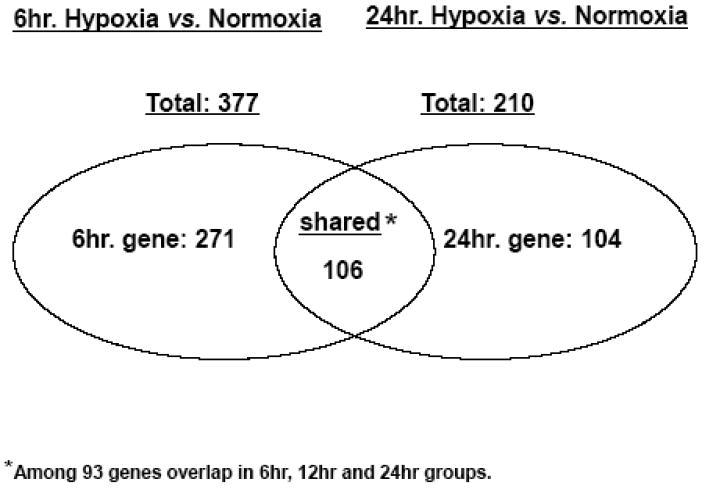
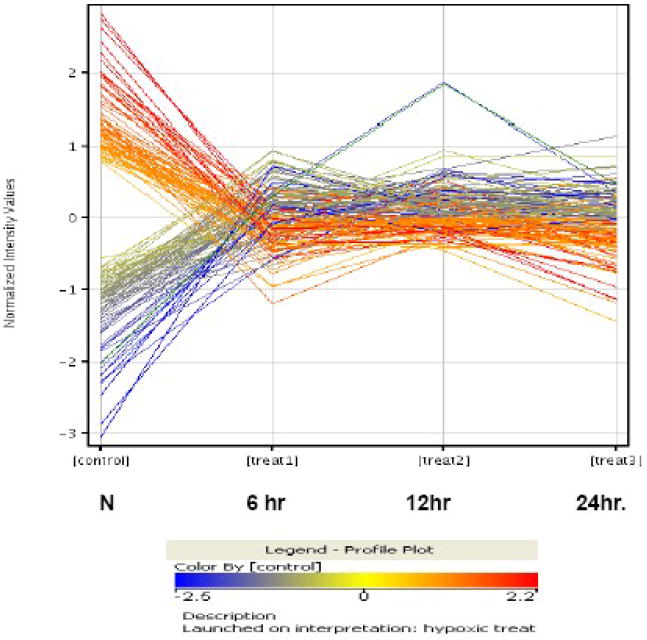
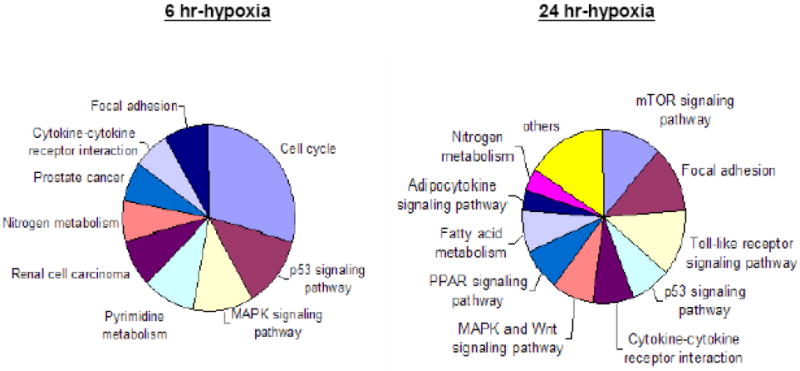
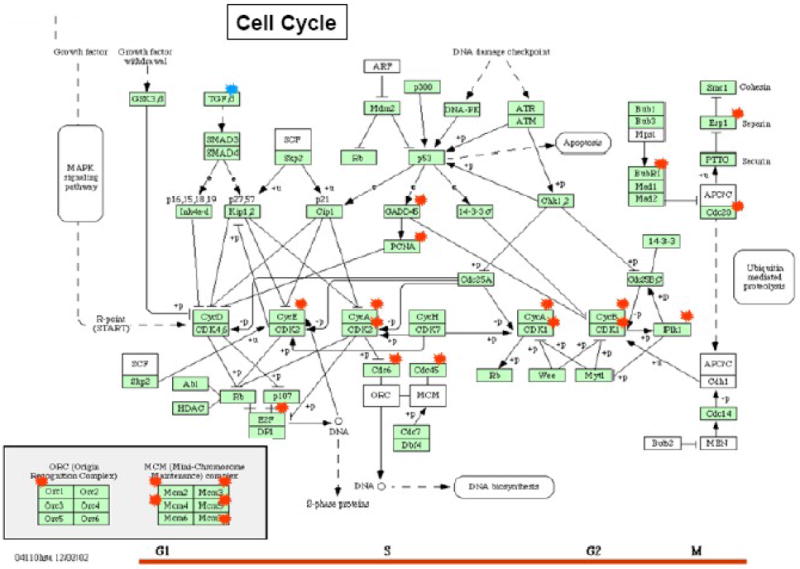
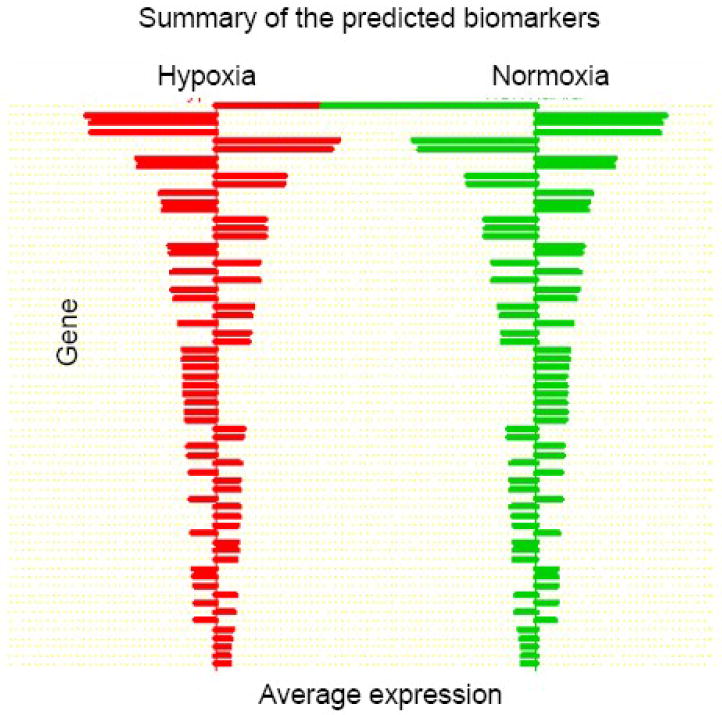
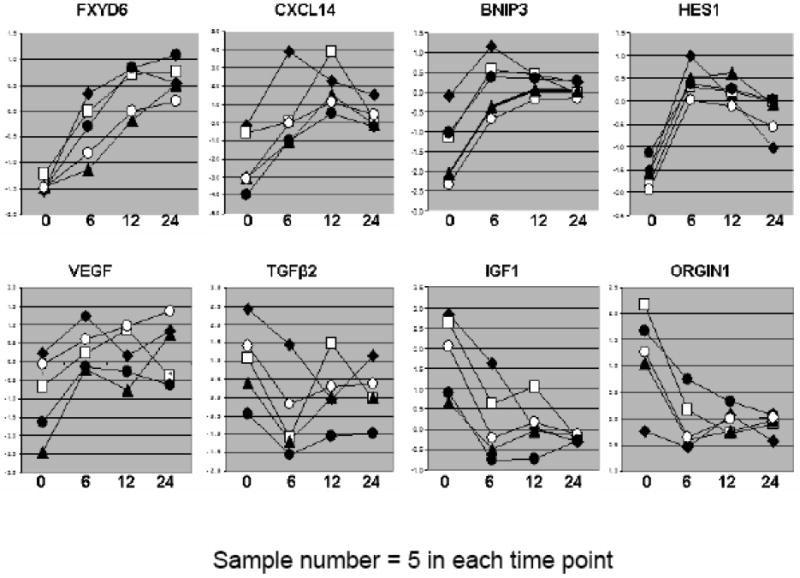
This study sought to identify the gene expression patterns of porcine bone marrow-derived MSC in response to hypoxia and to investigate novel specific hypoxic targets that may have a role in determining MSC proliferation/survival and differentiation. MSC from 15 animals were incubated in 1% oxygen and 8% carbon dioxide for 6, 12, and 24 h. RNA samples were isolated and assayed with Affymetrix porcine arrays and quantitative reverse-transcription PCR. Significant gene expression levels among the four groups of normoxia, 6-, 12-, and 24-h hypoxia were identified. The pattern in the 12-h hypoxia group was similar to that of the 24-h group. Of 23,924 probes, 377 and 210 genes were regulated in the 6- and 24-h hypoxia groups, respectively. Functional classification of the hypoxic regulated genes was mainly clustered in cell proliferation and response to stress. However, the major upregulated genes in the 6-h group were activated in cell cycle phases; the genes in the 24-h hypoxia were evenly separated into cell differentiation, apoptosis, and cellular metabolic processes. Twenty-eight genes were upregulated in all hypoxia groups; these genes are considered as hypoxic targets. Our results identified a genome-wide hypoxia-induced gene expression pattern in porcine MSC. This study provides a global view of molecular events in the cells during exposure to hypoxia and revealed a set of novel candidate hypoxic targets.


Figures

Figure 1
Figure 1. Overview the gene expression pattern in the cells during exposure in hypoxic condition
(A). The summary of PAM, showing 10x cross-validation probabilities for each given sample. Each sample's classification is marked by the symbols explained in the key at the bottom of the graph. All the samples of the 6hr hypoxic and normoxia are classified correctly; however, 4 and 2 of 12hr and 24hr hypoxia are misclassified, respectively. (B). The bar graph illustrates the features of the up- or down- regulated genes in three hypoxic groups. Comparing to normoxia, the upregulated genes in the 6hr hypoxia are almost two times greater than the downregulated genes. However, the numbers of upregulated genes in 24hr hypoxia are close to the number of down-regulated genes. (C). A paired analysis of significant gene expression in the 6hr H vs. N and 24hr H vs. N. The left Venn diagram represents the total number of genes that were significantly differentially expressed between the 6hr hypoxia, whereas the right Venn diagram represent the total number of genes significantly differentially expressed between 24hr hypoxia and normoxia. (D). A profile plot that summarized an analysis from GenespringGX9.0 displayed a dynamic gene regulation profile in cells during exposure in hypoxia in different time point. All hypoxia groups compared to the normoxia, each line represents one gene. The red color signifies the gene was highly expression in normoxia and lower expression in hypoxic samples and blue denote a lower expressed genes in control but higher in hypoxic groups.
Figure 2
Figure 2. Pathway analysis
(A). Pie graphs illustrate the proportions of the regulated genes enriched in cell signaling pathway. (B). Illustration of the hypoxia induced genes employed in the cell cycle pathway (KEGG database) The Red and blue symbol represent the genes up- or down-regulated in 6hr H group, respectively.
Figure 3
Figure 3. Hypoxic targets prediction and data validation
(A). Centroids from comparison between hypoxia and normoxia for biomarker prediction by PAM. Upregulated genes are designated by rightward-extending bars; those that down regulated protrude to lift. (B). Dynamic gene expression in sample by GeneSpring9.0. The y-axis represents gene expression lever and x-axis stands for the time of cell treated with hypoxia. (C). qRT-PCR validation. Six individual genes were tested for the validation of microarray data. The y-axis stands for the relative expression level between hypoxia and normoxia (fold change, hypoxia/normoxia).

Similar articles

Cited by

References

    1. Barry FP. Biology and clinical applications of mesenchymal stem cells. Birth Defects Res C Embryo Today. 2003;69(3):250. - PubMed
    1. Bobis S, Jarocha D, Majka M. Mesenchymal stem cells: characteristics and clinical applications. Folia Histochem Cytobiol. 2006;44(4):215. - PubMed
    1. Festy F, Hoareau L, Bes-Houtmann S, et al. Surface protein expression between human adipose tissue-derived stromal cells and mature adipocytes. Histochem Cell Biol. 2005;124(2):113. - PubMed
    1. Jeong JA, Hong SH, Gang EJ, et al. Differential gene expression profiling of human umbilical cord blood-derived mesenchymal stem cells by DNA microarray. Stem Cells. 2005;23(4):584. - PubMed
    1. Kermani AJ, Fathi F, Mowla SJ. Characterization and genetic manipulation of human umbilical cord vein mesenchymal stem cells: potential application in cell-based gene therapy. Rejuvenation Res. 2008;11(2):379. - PubMed

Publication types

MeSH terms

LinkOut - more resources