

Dimeric arrangement of the parathyroid hormone receptor and a structural mechanism for ligand-induced dissociation
- PMID: 20172855
- PMCID: PMC2852981
- DOI: 10.1074/jbc.M109.093138
Dimeric arrangement of the parathyroid hormone receptor and a structural mechanism for ligand-induced dissociation
Abstract
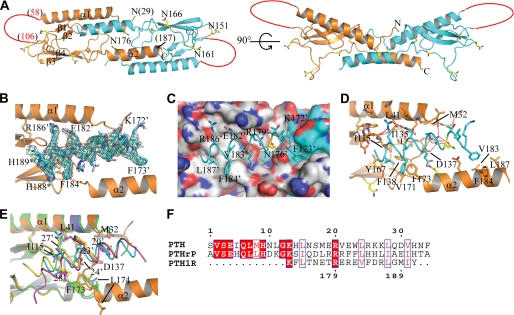
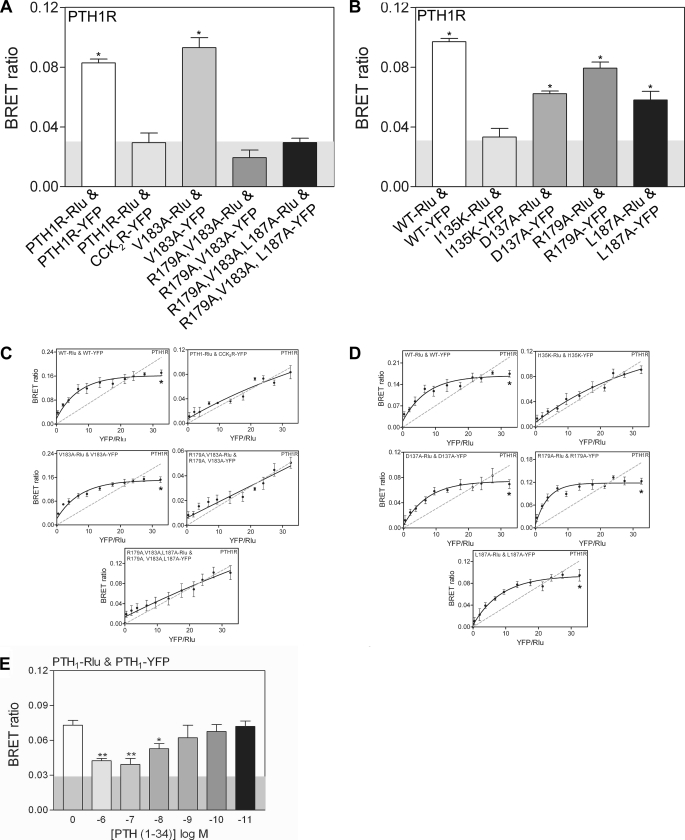
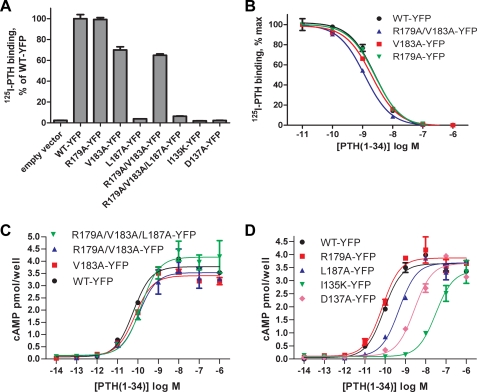
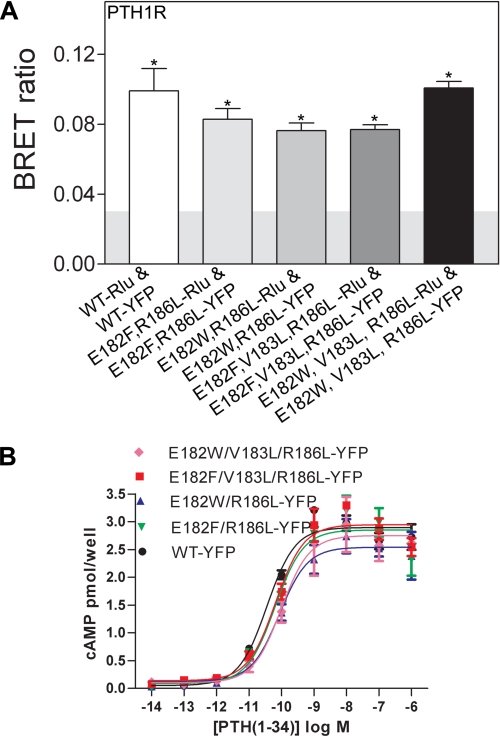
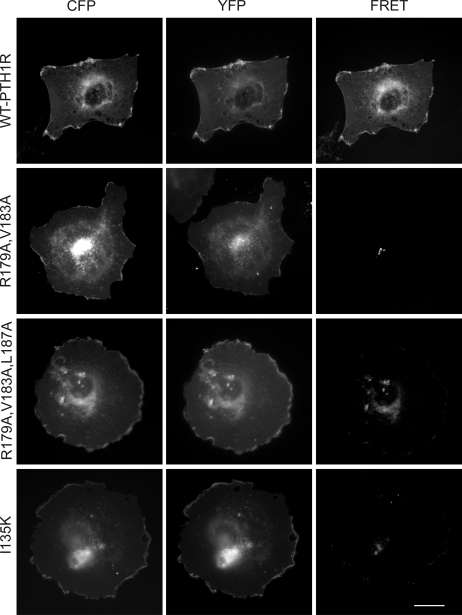
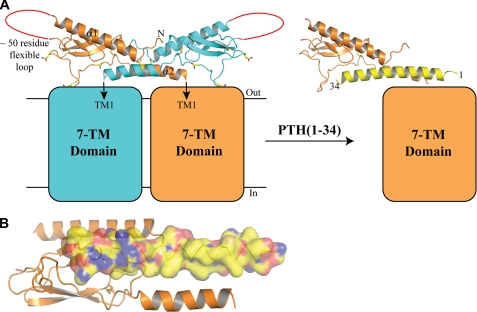
The parathyroid hormone receptor (PTH1R) is a class B G protein-coupled receptor that is activated by parathyroid hormone (PTH) and PTH-related protein (PTHrP). Little is known about the oligomeric state of the receptor and its regulation by hormone. The crystal structure of the ligand-free PTH1R extracellular domain (ECD) reveals an unexpected dimer in which the C-terminal segment of both ECD protomers forms an alpha-helix that mimics PTH/PTHrP by occupying the peptide binding groove of the opposing protomer. ECD-mediated oligomerization of intact PTH1R was confirmed in living cells by bioluminescence and fluorescence resonance energy transfer experiments. As predicted by the structure, PTH binding disrupted receptor oligomerization. A receptor rendered monomeric by mutations in the ECD retained wild-type PTH binding and cAMP signaling ability. Our results are consistent with the hypothesis that PTH1R forms constitutive dimers that are dissociated by ligand binding and that monomeric PTH1R is capable of activating G protein.
Figures
Similar articles
-
Structural basis for parathyroid hormone-related protein binding to the parathyroid hormone receptor and design of conformation-selective peptides.J Biol Chem. 2009 Oct 9;284(41):28382-28391. doi: 10.1074/jbc.M109.022905. Epub 2009 Aug 12. J Biol Chem. 2009. PMID: 19674967 Free PMC article.
-
Analysis of parathyroid hormone (PTH)/secretin receptor chimeras differentiates the role of functional domains in the pth/ pth-related peptide (PTHrP) receptor on hormone binding and receptor activation.Mol Endocrinol. 2001 Jul;15(7):1186-99. doi: 10.1210/mend.15.7.0665. Mol Endocrinol. 2001. PMID: 11435617
-
Transmembrane residues together with the amino terminus limit the response of the parathyroid hormone (PTH) 2 receptor to PTH-related peptide.J Biol Chem. 1998 Feb 13;273(7):3830-7. doi: 10.1074/jbc.273.7.3830. J Biol Chem. 1998. PMID: 9461563
-
The parathyroid hormone receptorsome and the potential for therapeutic intervention.Curr Drug Targets. 2012 Jan;13(1):116-28. doi: 10.2174/138945012798868416. Curr Drug Targets. 2012. PMID: 21777186 Review.
-
Molecular mechanisms of ligand recognition by parathyroid hormone 1 (PTH1) and PTH2 receptors.Curr Pharm Des. 2001 May;7(8):689-713. doi: 10.2174/1381612013397825. Curr Pharm Des. 2001. PMID: 11375776 Review.
Cited by
-
Glucagon-like peptide-1 receptor dimerization differentially regulates agonist signaling but does not affect small molecule allostery.Proc Natl Acad Sci U S A. 2012 Nov 6;109(45):18607-12. doi: 10.1073/pnas.1205227109. Epub 2012 Oct 22. Proc Natl Acad Sci U S A. 2012. PMID: 23091034 Free PMC article.
-
Noncanonical control of vasopressin receptor type 2 signaling by retromer and arrestin.J Biol Chem. 2013 Sep 27;288(39):27849-60. doi: 10.1074/jbc.M112.445098. Epub 2013 Aug 9. J Biol Chem. 2013. PMID: 23935101 Free PMC article.
-
Bacterial expression and purification of a heterodimeric adrenomedullin receptor extracellular domain complex using DsbC-assisted disulfide shuffling.Protein Expr Purif. 2013 Mar;88(1):107-13. doi: 10.1016/j.pep.2012.11.019. Epub 2012 Dec 13. Protein Expr Purif. 2013. PMID: 23247088 Free PMC article.
-
The Pseudo signal peptide of the corticotropin-releasing factor receptor type 2A prevents receptor oligomerization.J Biol Chem. 2012 Aug 3;287(32):27265-74. doi: 10.1074/jbc.M112.360594. Epub 2012 Jun 11. J Biol Chem. 2012. PMID: 22689579 Free PMC article.
-
New Insights into the Structure and Function of Class B1 GPCRs.Endocr Rev. 2023 May 8;44(3):492-517. doi: 10.1210/endrev/bnac033. Endocr Rev. 2023. PMID: 36546772 Free PMC article.
References
-
- Fotiadis D., Jastrzebska B., Philippsen A., Müller D. J., Palczewski K., Engel A. (2006) Curr. Opin. Struct. Biol. 16, 252–259 - PubMed
-
- Bulenger S., Marullo S., Bouvier M. (2005) Trends Pharmacol. Sci. 26, 131–137 - PubMed
-
- Chabre M., le Maire M. (2005) Biochemistry 44, 9395–9403 - PubMed
-
- Rios C. D., Jordan B. A., Gomes I., Devi L. A. (2001) Pharmacol. Ther. 92, 71–87 - PubMed
Publication types
MeSH terms
Substances
Grants and funding
LinkOut - more resources
Full Text Sources
Molecular Biology Databases
Research Materials
