

The hospital standardised mortality ratio: a powerful tool for Dutch hospitals to assess their quality of care?
- PMID: 20172876
- PMCID: PMC2921266
- DOI: 10.1136/qshc.2009.032953
The hospital standardised mortality ratio: a powerful tool for Dutch hospitals to assess their quality of care?
Abstract
Aim of the study: To use the hospital standardised mortality ratio (HSMR), as a tool for Dutch hospitals to analyse their death rates by comparing their risk-adjusted mortality with the national average.
Method: The method uses routine administrative databases that are available nationally in The Netherlands--the National Medical Registration dataset for the years 2005-2007. Diagnostic groups that led to 80% of hospital deaths were included in the analysis. The method adjusts for a number of case-mix factors per diagnostic group determined through a logistic regression modelling process.
Results: In The Netherlands, the case-mix factors are primary diagnosis, age, sex, urgency of admission, length of stay, comorbidity (Charlson Index), social deprivation, source of referral and month of admission. The Dutch HSMR model performs well at predicting a patient's risk of death as measured by a c statistic of the receiver operating characteristic curve of 0.91. The ratio of the HSMR of the Dutch hospital with the highest value in 2005-2007 is 2.3 times the HSMR of the hospital with the lowest value.
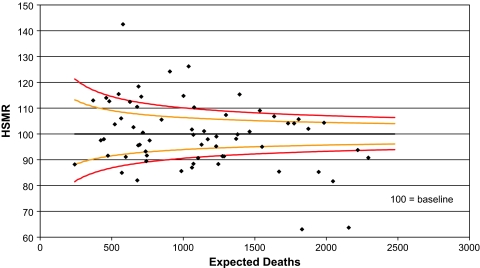
Discussion: Overall hospital HSMRs and mortality at individual diagnostic group level can be monitored using statistical process control charts to give an early warning of possible problems with quality of care. The use of routine data in a standardised and robust model can be of value as a starting point for improvement of Dutch hospital outcomes. HSMRs have been calculated for several other countries.
Conflict of interest statement
Figures
References
-
- Learning from Bristol: the report of the public inquiry into children's heart surgery at the Bristol Royal Infirmary 1984–1995. http://www.bristol-inquiry.org.uk/ - PubMed
-
- De Jonge E, Bosman RJ, van der Voort PH, et al. Intensive care geneeskunde in Nederland 1997–2001. I. Patientenpopulatie en behandelresultaten [Patient populations and results of treatment]. Ned Tijdschr Geneeskd 2003;147:1013–7 - PubMed
-
- Obertop H. Oefening baart kunst. Gunstige effecten van ervaring op behandelresultaten [Practice makes perfect. Favourable effects of routine on results of treatment]. Ned Tijdschr Geneeskd 2004;148:1327–9 - PubMed
Publication types
MeSH terms
LinkOut - more resources
Full Text Sources
Research Materials