

GOing Bayesian: model-based gene set analysis of genome-scale data
- PMID: 20172960
- PMCID: PMC2887944
- DOI: 10.1093/nar/gkq045
GOing Bayesian: model-based gene set analysis of genome-scale data
Abstract
The interpretation of data-driven experiments in genomics often involves a search for biological categories that are enriched for the responder genes identified by the experiments. However, knowledge bases such as the Gene Ontology (GO) contain hundreds or thousands of categories with very high overlap between categories. Thus, enrichment analysis performed on one category at a time frequently returns large numbers of correlated categories, leaving the choice of the most relevant ones to the user's; interpretation. Here we present model-based gene set analysis (MGSA) that analyzes all categories at once by embedding them in a Bayesian network, in which gene response is modeled as a function of the activation of biological categories. Probabilistic inference is used to identify the active categories. The Bayesian modeling approach naturally takes category overlap into account and avoids the need for multiple testing corrections met in single-category enrichment analysis. On simulated data, MGSA identifies active categories with up to 95% precision at a recall of 20% for moderate settings of noise, leading to a 10-fold precision improvement over single-category statistical enrichment analysis. Application to a gene expression data set in yeast demonstrates that the method provides high-level, summarized views of core biological processes and correctly eliminates confounding associations.
Figures
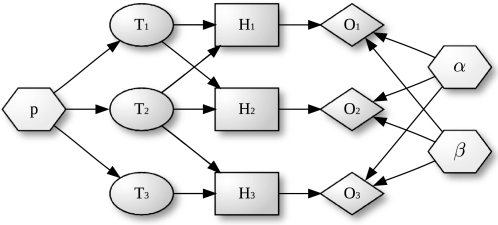
 , ellipses) can be either on or off. Terms that are on activate the hidden state (
 , rectangles) of all genes annotated to them, the other genes remain off. The observed states (
 , diamonds) of the genes are noisy observations of their true hidden state. The parameters of the model (light gray nodes) are the prior probability of each term to be active,
  , the false positive rate,
  and the false negative rate,
  .
.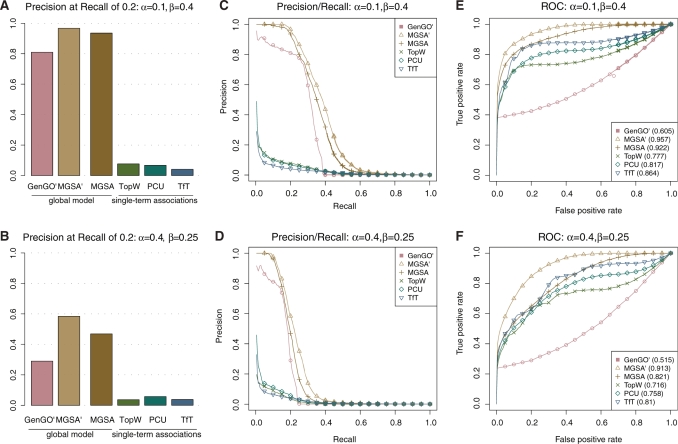
 , MGSA
 and MGSA algorithms on simulated data set with different settings of false positive (
 ) and false negative (
 ) rates. In each row, the leftmost panel shows the precision for a recall of 0.2 (A, B), the middle panel precision as a function of recall (C, D) and the rightmost panel the ROC curve (E, F).
References
-
- Rhee SY, Wood V, Dolinski K, Draghici S. Use and misuse of the Gene Ontology annotations. Nat. Rev. Genet. 2008;9:509–515. - PubMed
-
- Jiang Z, Gentleman R. Extensions to gene set enrichment. Bioinformatics. 2007;23:306–313. - PubMed
-
- Mootha VK, Lindgren CM, Eriksson K.-F, Subramanian A, Sihag S, Lehar J, Puigserver P, Carlsson E, Ridderstrle M, Laurila E, et al. PGC-1α-responsive genes involved in oxidative phosphorylation are coordinately downregulated in human diabetes. Nat. Genet. 2003;34:267–273. - PubMed
Publication types
MeSH terms
LinkOut - more resources
Full Text Sources
Other Literature Sources
Medical
Molecular Biology Databases
Miscellaneous
