. 2010 Feb;22(2):113-28.
doi: 10.1093/intimm/dxp118.

Interaction between activated chemokine receptor 1 and FcepsilonRI at membrane rafts promotes communication and F-actin-rich cytoneme extensions between mast cells

Affiliations

Interaction between activated chemokine receptor 1 and FcepsilonRI at membrane rafts promotes communication and F-actin-rich cytoneme extensions between mast cells

Nimita H Fifadara et al. Int Immunol. 2010 Feb.

Abstract

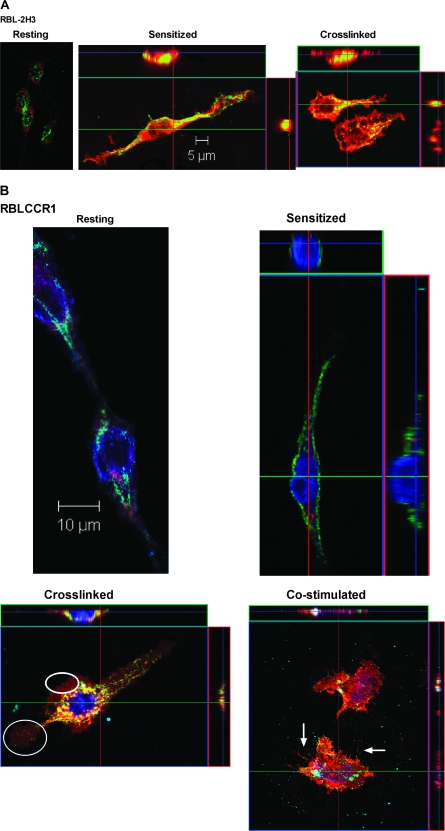
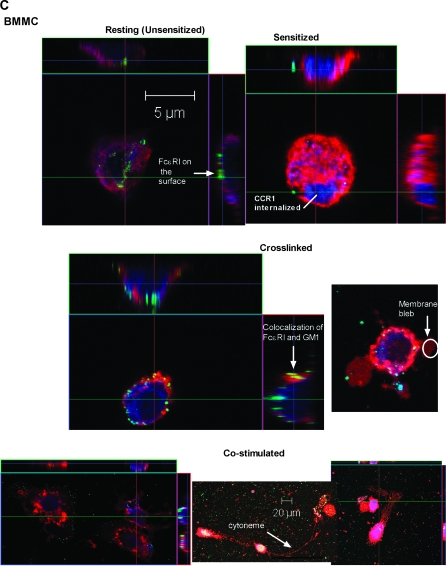
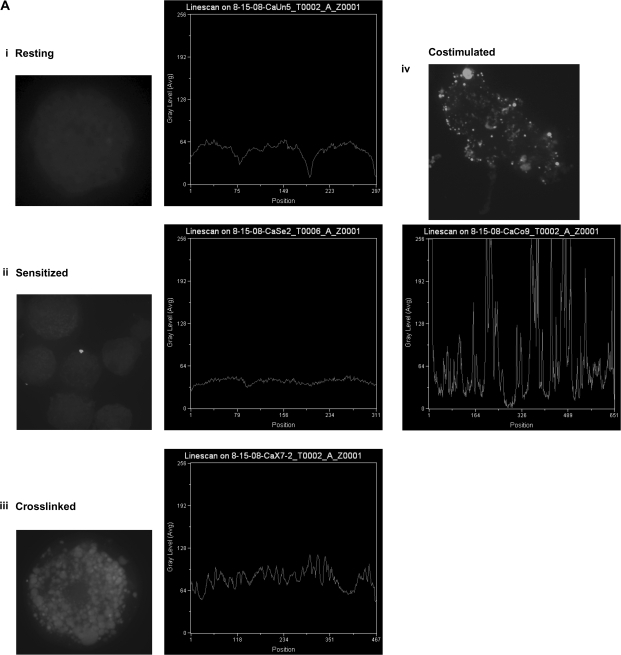
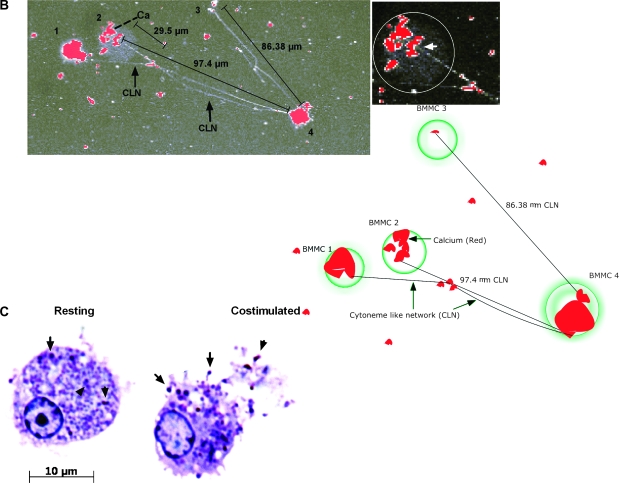
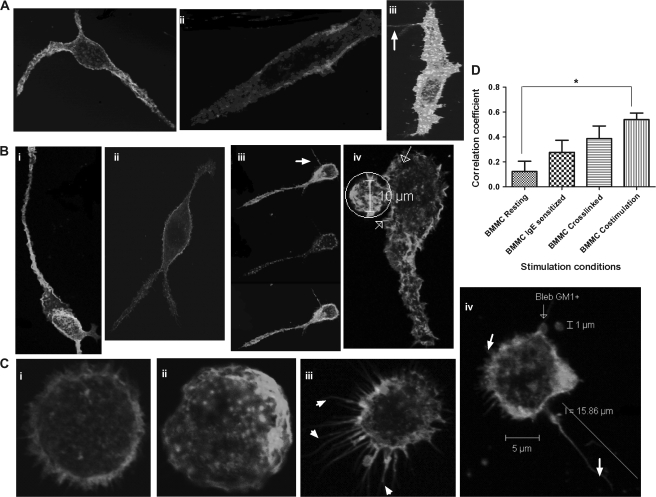
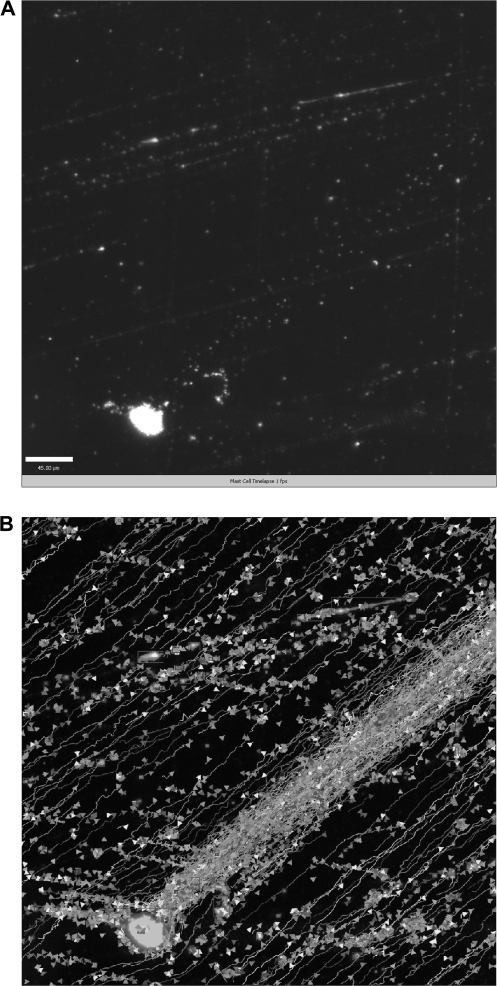
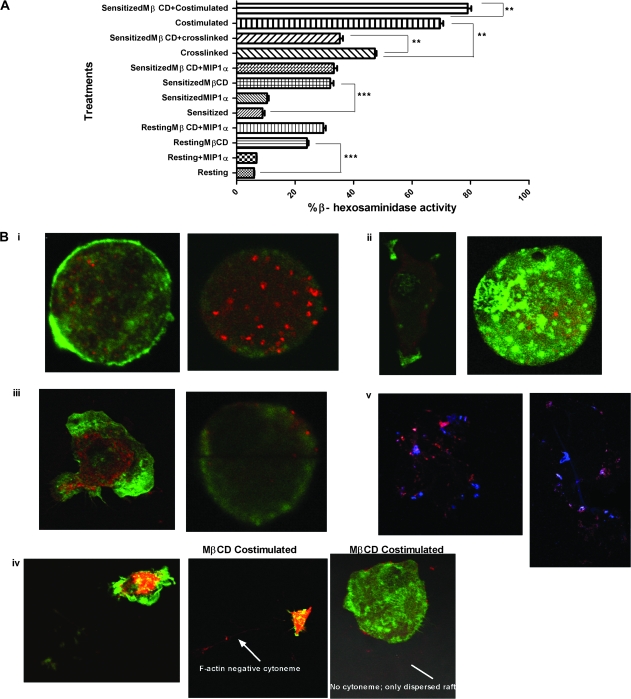
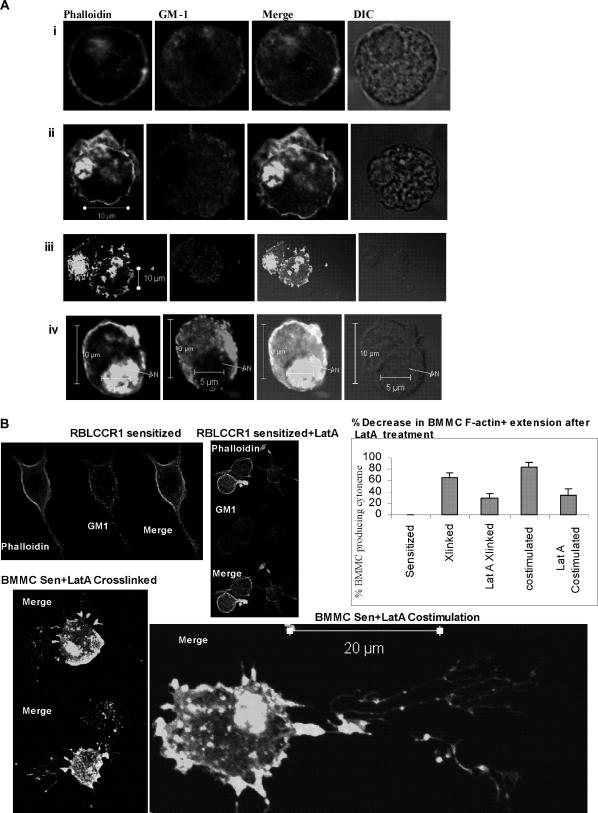
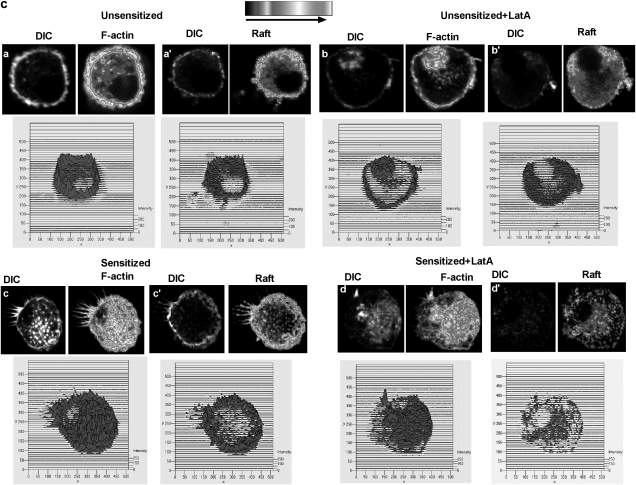
Chemokines play important regulatory roles in immunity, but their contributions to mast cell function remain poorly understood. We examined the effects of FcepsilonRI-chemokine receptor (CCR) 1 co-stimulation on receptor localization and cellular morphology of bone marrow-derived mast cells. Whereas FcepsilonRI and CCR1 co-localized at the plasma membrane in unsensitized cells, sensitization with IgE promoted internalization of CCR1 molecules. Co-stimulation of FcepsilonRI and CCR1 with antigen and macrophage inflammatory protein-1alpha was more effective than FcepsilonRI stimulation alone in causing leading edge formation, flattened morphology, membrane ruffles and ganglioside (GM1(+)) lipid mediator release. Co-stimulation resulted in phalloidin-positive cytoneme-like cellular extensions, also known as tunneling nanotubes, which originated at points of calcium accumulation. This is the first report of cytoneme formation by mast cells. To determine the importance of lipid rafts for mast cell function, the cells were cholesterol depleted. Cholesterol depletion enhanced degranulation in resting, sensitized and co-stimulated cells, but not in FcepsilonRI-cross-linked cells, and inhibited formation of filamentous actin(+) cytonemes but not GM1(+) cytonemes. Treatment with latrunculin A to sequester globular-actin abolished cytoneme formation. The cytonemes may participate in intercellular communication during allergic and inflammatory responses, and their presence in the co-stimulated mast cells suggests new roles for CCRs in immunopathology.


Figures

Fig. 1.
Fig. 1.
CCR1+ BMMC co-stimulated with FcεRI- and CCR1-specific ligands develop GM1-rich cytonemes. Mast cells were kept resting, sensitized overnight, cross-linked with antigen for 5 min or co-stimulated with antigen and MIP-1α for 5 min. Cells were immunostained for FcεRI (green), CCR1 (blue) and GM1 (red). Co-localization between raft-FcεRI-CCR1 (white), raft-CCR1 (magenta), FcεRI-CCR1 (cyan) and raft-FcεRI (yellow) is observed upon stimulation. Best representative co-localizations in particular stimulation conditions are shown here using top (FcεRI, CCR1 and GM1), central or bottom planes (cytonemes). (A) CCR1 RBL-2H3 control cells showing distribution of FcεRI and GM1 in resting, sensitized and cross-linked conditions. (B) CCR1+ RBL-2H3 cells (RBL-CCR1) showing distribution of FcεRI, CCR1 and GM1 in resting, sensitized, cross-linked and co-stimulated conditions. The circle highlights a membrane ruffle, and the arrows indicate cytoneme-like structures. (C) BMMC showing distribution of FcεRI, CCR1 and GM1 in resting, sensitized, cross-linked and co-stimulated conditions.
Fig. 1.
Fig. 1.
CCR1+ BMMC co-stimulated with FcεRI- and CCR1-specific ligands develop GM1-rich cytonemes. Mast cells were kept resting, sensitized overnight, cross-linked with antigen for 5 min or co-stimulated with antigen and MIP-1α for 5 min. Cells were immunostained for FcεRI (green), CCR1 (blue) and GM1 (red). Co-localization between raft-FcεRI-CCR1 (white), raft-CCR1 (magenta), FcεRI-CCR1 (cyan) and raft-FcεRI (yellow) is observed upon stimulation. Best representative co-localizations in particular stimulation conditions are shown here using top (FcεRI, CCR1 and GM1), central or bottom planes (cytonemes). (A) CCR1 RBL-2H3 control cells showing distribution of FcεRI and GM1 in resting, sensitized and cross-linked conditions. (B) CCR1+ RBL-2H3 cells (RBL-CCR1) showing distribution of FcεRI, CCR1 and GM1 in resting, sensitized, cross-linked and co-stimulated conditions. The circle highlights a membrane ruffle, and the arrows indicate cytoneme-like structures. (C) BMMC showing distribution of FcεRI, CCR1 and GM1 in resting, sensitized, cross-linked and co-stimulated conditions.
Fig. 2.
Fig. 2.
Costimulation of BMMC results in Ca2+ accumulation at random points and formation of cytonemes. (A) Accumulation of intracellular calcium in BMMC that were resting (i), sensitized (ii), crosslinked with antigen for 1 min (iii), and costimulated with antigen and MIP-1α (iv). Live cells were visualized using fluorescent Fluo-3 AM dye, which specifically binds to Ca2+ (clusters). Line graphs showing signal intensity are also provided. (B) Cytoneme formation by CCR1+ BMMC after 5 min of costimulation. Calcium is shown in red, and cytoneme-like networks (CLN) connect neighboring cells. The right panel is an enlargement of cell #2. The circle encompasses the cell border, and the arrow indicates a cytoneme origination point. (C) Granule accumulation at the membrane and in cytonemes of costimulated cells. BMMC that were resting or stimulated for 1 min with antigen and MIP-1α were cut into 1 μm sections and stained with 0.1% toluidine blue. Granules can be observed both within the cytoplasm and within the cell extensions (arrows).
Fig. 2.
Fig. 2.
Costimulation of BMMC results in Ca2+ accumulation at random points and formation of cytonemes. (A) Accumulation of intracellular calcium in BMMC that were resting (i), sensitized (ii), crosslinked with antigen for 1 min (iii), and costimulated with antigen and MIP-1α (iv). Live cells were visualized using fluorescent Fluo-3 AM dye, which specifically binds to Ca2+ (clusters). Line graphs showing signal intensity are also provided. (B) Cytoneme formation by CCR1+ BMMC after 5 min of costimulation. Calcium is shown in red, and cytoneme-like networks (CLN) connect neighboring cells. The right panel is an enlargement of cell #2. The circle encompasses the cell border, and the arrow indicates a cytoneme origination point. (C) Granule accumulation at the membrane and in cytonemes of costimulated cells. BMMC that were resting or stimulated for 1 min with antigen and MIP-1α were cut into 1 μm sections and stained with 0.1% toluidine blue. Granules can be observed both within the cytoplasm and within the cell extensions (arrows).
Fig. 3.
Fig. 3.
BMMC cytonemes are F-actin rich and contain clusters of GM1+ lipid rafts. Mast cells were kept resting, sensitized overnight, cross-linked with antigen for 5 min or co-stimulated with antigen and MIP-1α for 5 min. Cells were permeabilized and stained for F-actin with phalloidin-Alexa 488 (green) and GM1 with cholera toxin-Alexa 555 (red). (A) RBL-2H3 cells showing distribution of F-actin and GM1 in (i) resting, (ii) sensitized and (iii) cross-linked conditions. The arrow indicates a cytoneme. (B) RBL-CCR1 cells showing distribution of F-actin and GM1 in (i) resting, (ii) sensitized, (iii) cross-linked and (iv) co-stimulated conditions. The arrows indicate cytonemes and the circle contains a cellular bleb. (C) BMMC showing distribution of F-actin and GM1 in (i) resting, (ii) sensitized, (iii) cross-linked and (iv) co-stimulated conditions. The arrows indicate cytonemes. (D) Mean correlation coefficients between F-actin and GM1+ rafts, as calculated from three random regions in each cell for five independent cells per condition. Error bars show SEM, *P < 0.05.
Fig. 4.
Fig. 4.
BMMC cytonemes extend in different directions following co-stimulation. Cytoneme formation from live, scattered, sensitized BMMC growing in a 25 cc tissue culture flask was captured immediately after addition of antigen and MIP-1α using dark field transmission on a spinning-disc confocal microscope and Volocity acquisition. (A) Image of a costimulated BMMC producing cytonemes in two different directions, at 2 O'clock and 10 O'clock, derived from a 26 min. time lapse video. (B) Tracks produced by each cytoneme (lines), and objects carried by these tracks (triangles) were determined using Volocity (Improvision, Perkin Elmer) quantitation. The analysis table summarizes the measurement protocols used for 3D analysis.
Fig. 5.
Fig. 5.
Cholesterol is required for optimal antigen-mediated signaling but not for optimal co-stimulation or relocalization of internalized CCR1 to the surface of BMMC. (A) Cholesterol was depleted from BMMC by treating resting and sensitized cells with 10 mM MβCD for 30 min at 37°C in serum-free buffer. Cells were washed twice and stimulated as appropriate for 30 min at 37°C and then degranulation was assessed by measuring β-hexosaminidase activity. Means shown were calculated from three independent experiments performed in triplicates. P < 0.05, where **P < 0.005 and ***P < 0.0005. (B) Control BMMC (left panels) or BMMC cholesterol depleted with MβCD (right panels) stained for F-actin (green) and GM1+ rafts (red) in (i) resting, (ii) sensitized, (iii) cross-linked and (iv) co-stimulation conditions. CCR1 [blue, (v) only] relocalized to the cell surface after cholesterol depletion. The arrow indicates a cytoneme.
Fig. 6.
Fig. 6.
Treatment of mast cells with LatA results in altered F-actin localization, diminished membrane expression of rafts and F-actin, and impaired F-actin+ cytoneme formation. (A) Effects of LatA treatment on F-actin, GM1 localization, and cell morphology, in BMMC. BMMC were treated with 250 ng/ml of Latrunculin A for 45 min, then left unstimulated (i), sensitized overnight (ii), sensitized and cross-linked with antigen for 5 min (iii) or sensitized and stimulated with antigen and MIP-1α for 5 min (iv). After permeabilization using 0.1% triton X100, cells were stained for F-actin using phalloidin-Alexa 488 and for GM1+ rafts using cholera toxin-Alexa 555. Differential-interference-contrast (DIC) images are also provided to show the nuclear structure. N, nucleus. (B) Sensitized RBL-CCR1 cells, untreated and treated with LatA. The untreated cells (top left panel) display typical basophil morphology and lack cytonemes. Cells treated with LatA (top right panel) lack typical basophil cytoskeleton morphology, and instead display cell swelling and small radial elongations (not cytonemes). Cross-linked or costimulated BMMC treated with LatA (bottom panels) failed to produce directional cytoneme extensions (>50 μm) and instead formed short branched extensions. Cells were stained for F-actin (phalloidin) and GM1 as described above. The proportion of cells producing cytonemes, shown in the graph, was determined by manually examining 30 cells/condition in 3 separate experiments. ***,P< 0.0005. (C) Effects of LatA treatment on F-actin and GM1 intensity in unsensitized and sensitized BMMC. Resting BMMC without and with Lat A treatment, and sensitized BMMC without and with LatA treatment were stained for F-actin using phalloidin-Alexa 488 (a, b, c, d respectively) and GM1 using cholera toxin-Alexa-555 (a', b', c', d'), respectively. Deconvolution images were created using Metamorph image analysis. Simultaneous 3D intensity distribution is also shown.
Fig. 6.
Fig. 6.
Treatment of mast cells with LatA results in altered F-actin localization, diminished membrane expression of rafts and F-actin, and impaired F-actin+ cytoneme formation. (A) Effects of LatA treatment on F-actin, GM1 localization, and cell morphology, in BMMC. BMMC were treated with 250 ng/ml of Latrunculin A for 45 min, then left unstimulated (i), sensitized overnight (ii), sensitized and cross-linked with antigen for 5 min (iii) or sensitized and stimulated with antigen and MIP-1α for 5 min (iv). After permeabilization using 0.1% triton X100, cells were stained for F-actin using phalloidin-Alexa 488 and for GM1+ rafts using cholera toxin-Alexa 555. Differential-interference-contrast (DIC) images are also provided to show the nuclear structure. N, nucleus. (B) Sensitized RBL-CCR1 cells, untreated and treated with LatA. The untreated cells (top left panel) display typical basophil morphology and lack cytonemes. Cells treated with LatA (top right panel) lack typical basophil cytoskeleton morphology, and instead display cell swelling and small radial elongations (not cytonemes). Cross-linked or costimulated BMMC treated with LatA (bottom panels) failed to produce directional cytoneme extensions (>50 μm) and instead formed short branched extensions. Cells were stained for F-actin (phalloidin) and GM1 as described above. The proportion of cells producing cytonemes, shown in the graph, was determined by manually examining 30 cells/condition in 3 separate experiments. ***,P< 0.0005. (C) Effects of LatA treatment on F-actin and GM1 intensity in unsensitized and sensitized BMMC. Resting BMMC without and with Lat A treatment, and sensitized BMMC without and with LatA treatment were stained for F-actin using phalloidin-Alexa 488 (a, b, c, d respectively) and GM1 using cholera toxin-Alexa-555 (a', b', c', d'), respectively. Deconvolution images were created using Metamorph image analysis. Simultaneous 3D intensity distribution is also shown.

Similar articles

Cited by

References

    1. Kawakami T, Galli SJ. Regulation of mast-cell and basophil function and survival by IgE. Nat. Rev. Immunol. 2002;2:773. - PubMed
    1. Henz BM, Maurer M, Lippert U, Worm M, Babina M. Mast cells as initiators of immunity and host defense. Exp. Dermatol. 2001;10:1. - PubMed
    1. Taylor ML, Metcalfe DD. Mast cells in allergy and host defense. Allergy Asthma Proc. 2001;22:115. - PubMed
    1. Pulendran B, Ono SJ. A shot in the arm for mast cells. Nat. Med. 2008;14:489. - PubMed
    1. Metcalfe DD, Baram D, Mekori YA. Mast cells. Physiol. Rev. 1997;77:1033. - PubMed

Publication types

MeSH terms