. 2010 Feb 15;588(Pt 4):651-70.
doi: 10.1113/jphysiol.2010.183798.

Persistent Nav1.6 current at axon initial segments tunes spike timing of cerebellar granule cells

Affiliations

Persistent Nav1.6 current at axon initial segments tunes spike timing of cerebellar granule cells

Nancy Osorio et al. J Physiol. .

Erratum in

  • J Physiol. 2011 Jan 15;589(Pt 2):447

Abstract

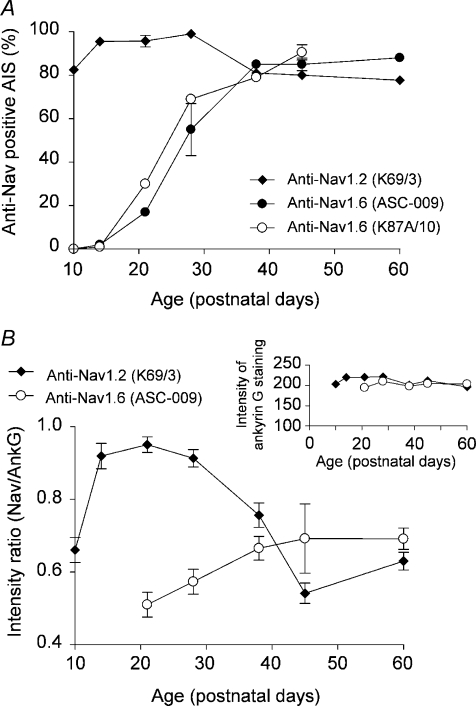
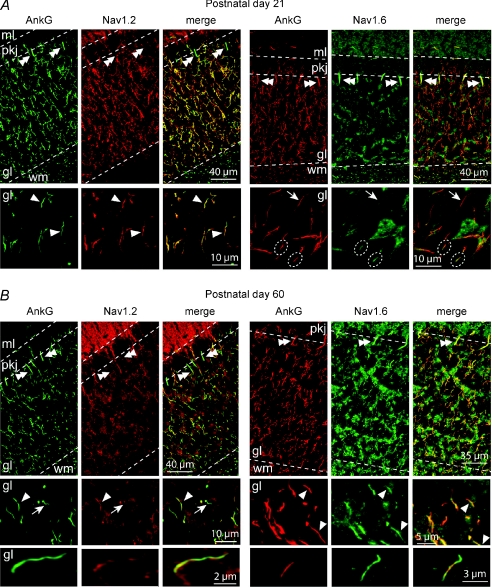
Cerebellar granule (CG) cells generate high-frequency action potentials that have been proposed to depend on the unique properties of their voltage-gated ion channels. To address the in vivo function of Nav1.6 channels in developing and mature CG cells, we combined the study of the developmental expression of Nav subunits with recording of acute cerebellar slices from young and adult granule-specific Scn8a KO mice. Nav1.2 accumulated rapidly at early-formed axon initial segments (AISs). In contrast, Nav1.6 was absent at early postnatal stages but accumulated at AISs of CG cells from P21 to P40. By P40-P65, both Nav1.6 and Nav1.2 co-localized at CG cell AISs. By comparing Na(+) currents in mature CG cells (P66-P74) from wild-type and CG-specific Scn8a KO mice, we found that transient and resurgent Na(+) currents were not modified in the absence of Nav1.6 whereas persistent Na(+) current was strongly reduced. Action potentials in conditional Scn8a KO CG cells showed no alteration in threshold and overshoot, but had a faster repolarization phase and larger post-spike hyperpolarization. In addition, although Scn8a KO CG cells kept their ability to fire action potentials at very high frequency, they displayed increased interspike-interval variability and firing irregularity in response to sustained depolarization. We conclude that Nav1.6 channels at axon initial segments contribute to persistent Na(+) current and ensure a high degree of temporal precision in repetitive firing of CG cells.


Figures

Figure 2
Figure 2. Developmental regulation of Nav1.2 and Nav1.6 clustering at CG cell AISs in mice aged P10–P60
A, percentage of total ankyrin G-labelled AISs in the granular layer showing staining for Nav1.2 (monoclonal K69/3 antibody) and Nav1.6 (polyclonal ASC-009 and monoclonal K87A/10) in cerebella from mice aged from P10 to P60. Each data point is the mean ±s.e.m. of 200 to 500 ankyrin G positive AISs obtained from at least 3 different animals for each staining condition and developmental stage. B, developmental change in the intensity of Nav1.2 (K69/3 antibody) and Nav1.6 (K87A/10 antibody) immunofluorescence relative to the intensity of ankyrin G immunostaining at the same AIS. Between 30 and 50 AISs were measured for each age from Nav1.2/ankyrin G and Nav1.6/ankyrin G double-labelled confocal images. Inset shows intensity (arbitrary unit) of ankyrin G staining at AISs, which was very much constant over age.
Figure 1
Figure 1. Differential expression of Nav1.6 and Nav1.2 at developing CG cell AISs
A, cryosections of a P21 WT mouse cerebellum were double-labelled with anti-ankyrin G (polyclonal) and anti-Nav1.2 (monoclonal K69/3) antibodies (left panels) or with anti-ankyrin G (monoclonal, 4G3F8) and anti-Nav1.6 (polyclonal ASC-009) antibodies (right panels). Upper panels, virtually all AISs located in the granular layer were stained with the anti-Nav1.2 antibody, whereas Purkinje cell AISs (double arrowheads) and nodes located in the white matter were clearly devoided of Nav1.2 labelling. Purkinje cell AISs as well as nodes in the white matter exhibited Nav1.6 staining. Images are projections of 21 consecutive optical sections spanning 3.3 μm. Bottom panels, expanded deconvolved projections of 11 consecutive optical sections spanning 1.7 μm in the granular layer, in which most CG cell AISs expressed Nav1.2 (arrowheads) and did not express Nav1.6 (arrows) or showed the first signs of Nav1.6 clustering at AISs (dashed circles). B, cryosections of a P60 WT mouse cerebellum were double-labelled with anti-ankyrin G (polyclonal) and anti-Nav1.2 (monoclonal K69/3) antibodies (left panels) and with anti-ankyrin G (monoclonal, 4G3F8) and anti-Nav1.6 (polyclonal ASC-009) antibodies (right panels). Upper panels, most AISs located in the granular layer were stained with the anti-Nav1.2 antibody, whereas Purkinje cell AISs (double arrowheads) and nodes located in the white matter were negative. Purkinje cell AISs and CG cell AISs (arrowheads) exhibited Nav1.6 clustering (see also Fig. 3B for Nav1.6 clustering at P60 Scn8aflox/flox CG cells). Images are projections of 21 consecutive optical sections spanning 3.3 μm. Middle panels, projections of 11 consecutive optical sections spanning 1.7 μm in the granular layer showing Nav1.2-positive or Nav1.6-positive (arrowheads) and Nav1.2-negative (arrows) CG cell AISs. Lower panels, deconvolved images showing fragmented Nav1.2 staining (left) and Nav1.6 labelling (right) at P60 CG cell AISs. Images are deconvolved projection of 7 consecutive optical sections spanning 1 μm. ml, molecular layer; pkj: Purkinje cell layer; gl: granular layer; wm: white matter.
Figure 3
Figure 3. Conditional inactivation of the Scn8a gene in CG cells
A, PCR amplification of genomic DNA and cDNA (obtained from reverse transcription of mRNA) from the cerebellum and extra-cerebellar brain of a Scn8aflox/flox–Cre+ (Scn8a CG KO) mouse. Flox primers amplified a 0.9 kb product from the floxed Scn8a gene and a 0.3 kb product from the truncated Scn8a, which was detected only in cerebellum. Cre primers amplified a 0.2 kb product. RT-PCR primers amplified a 0.65 kb product from the full-length transcripts and a 0.35 kb fragment from transcripts lacking exon 1. The 0.35 kb amplicon was selectively detected in the cerebellum. RT (−) experiments were done omitting reverse transcriptase. B and C, cryosections of Scn8aflox/flox (B) and Scn8a KO CG (C) mouse cerebella (aged P60) were double-labelled with anti-ankyrin G (polyclonal) and anti-Nav1.6 (monoclonal K87A/10) antibodies. Scn8aflox/flox CG cell AISs showed strong Nav1.6 staining whereas ankyrin G positive AISs in the granular layer were clearly devoid of Nav1.6 in granule-specific Scn8a KO mice (arrows in C). Note that Purkinje cell AISs are still positive for Nav1.6 in granule-specific Scn8a KO mice (double arrowheads). Images are projections of 20 consecutive optical sections spanning 3.1 μm (upper panels) or 10 sections spanning 1.5 μm (bottom panels) in B and C. D, comparison of proportion of ankyrin G positive CG cell AISs that were positive for Nav1.2 or Nav1.6 in WT mice (data from Fig. 2A; open symbols) and Scn8a CG KO mice (filled symbols) at different ages. Data points for Scn8a CG KO mice are means ±s.e.m. of 200–300 AISs obtained from at least 2 animals for each staining condition and developmental stage. E, cryosections of a P60 Scn8a CG KO mouse cerebellum were double-labelled with anti-ankyrin G (monoclonal, 4G3F8) and anti-Nav1.1 (polyclonal) antibodies. No Nav1.1 positive AISs were detected in the granular layer. Images are projections of 21 consecutive optical sections spanning 3.3 μm. Inset: staining of AISs of Purkinje cells (arrowhead) and inhibitory interneurons (arrow) for Nav1.1 (green) and ankyrin G (red) from P19 med cerebellum. Scale bar: 20 μm.
Figure 4
Figure 4. Resurgent and persistent Na+ currents in CG cells from wild-type (left) and Scn8a CG KO (right) mice
A, currents recorded in response to an INaR activation protocol (upper subpanels) in a representative WT CG cell (cell C8514; a) and a representative Scn8a KO CG cell (cell H8509; b). Transient Na+ currents elicited by the test depolarization at 0 mV have been truncated (∼).The horizontal bars indicate the tracing region over which current data points were averaged to measure the amplitude of the sustained component (INaP), which was subtracted from the peak amplitude of the transient current elicited by repolarizing pulses to obtain a measurement of INaR amplitude. B, average INaR current–voltage (I–V) plots for WT CG cells (a) and Scn8a KO CG cells (b). The plots were obtained from currents recorded 6–9.5 min after break-in. INaR peak amplitudes were normalized for the maximal value observed in each cell, then averaged among cells. Data points and error bars are means ±s.d. (n= 12 and 11 in Ba and Bb, respectively). C, currents recorded in response to a ramp INaP activation protocol (upper subpanels) in a representative WT CG cell (Ca) and a representative Scn8a KO CG cell (Cb) (same cells as shown in Aa and Ab, respectively). In the lower subpanels the currents are shown as ‘instantaneous’I–V relationships. D, voltage dependence of the Na+ permeability underlying the ramp-activated INaP values shown in Ca and Cb. Na+-permeability values were obtained from current values by applying the Goldman equation as explained in Methods. Continuous white lines are best fits obtained by applying a single Boltzmann function. Fitting parameters are specified in each panel.
Figure 5
Figure 5. Amplitude of transient, resurgent, and persistent Na+ currents in CG cells from wild-type and Scn8a CG KO mice
Each panel shows amplitude values for INaT (A), INaR (B), and INaP (C) as determined at various time points after break-in (see the labels at the top of each subpanel). The parameters considered are: INaT absolute amplitude at the peak of its I–V (INaT(peak); Aa); INaT absolute amplitude at a voltage level positive by 20 mV to the I–V peak (INaT(peak+20); Ab); INaR absolute amplitude at the peak of its I–V (Ba); INaR peak amplitude relative to INaT(peak+20) amplitude (as a percentage; Bb); absolute, peak amplitude of ramp-evoked INaP (Ca); peak amplitude of ramp-evoked INaP relative to INaT(peak+20) amplitude (as a percentage; Cb). Note in C that both 0.1 mV ms−1 and 0.05 mV ms−1 ramps were applied to measure INaP amplitude (left and right parts of each subpanel, respectively). Open circles are individual values; filled squares indicate mean values ±s.e.m.
Figure 6
Figure 6. INaR activation kinetics is not affected by Scn8a knockout
A, voltage dependence of INaR time to peak (TTP) in WT (open circles) and Snc8a KO (filled circles) CG cells (n= 15 and 13 for WT and KO, respectively). B, currents recorded in response to the INaR activation protocol (see Fig. 4A) at three different repolarisation potentials (−20, −40 and −70 mV) in a representative WT neuron (cell A8514), and biexponential fittings (enhanced lines) of INaR activation and decay phases. Fitting parameters are: A1= 37.6 pA, τ1= 1.33 ms, A2=−50.1 pA, τ2= 21.3 ms, C=−13.2 pA (−20 mV); A1= 130.0 pA, τ1= 3.25 ms, A2=−166.3 pA, τ2= 20.2 ms, C=−15.4 pA (−40 mV); A2=−24.0 pA, τ2= 2.88 ms, C= 0.0 pA (−70 mV). C, voltage dependence of INaR activation time constant, τact (equivalent to panel B's τ1) (Ca), and INaR decay time constant, τdecay (equivalent to panel B's τ2) (Cb), in WT (open circles) and Snc8a KO (filled circles) CG cells (n= 15 and 13 for WT and KO, respectively).
Figure 7
Figure 7. Passive and firing properties of CG cells from wild-type and Scn8a CG knockout mice
A, characteristic responses of CG cells from WT (P37) and Snc8a CG KO (P59) mice to current injection (2 pA step increments). Shown are passive electrotonic responses to hyperpolarizing current pulse injections and responses up to the first current step that induced spiking in each cell. B, relationship between input conductance and firing threshold (the minimal current required to evoke action potentials) in WT (n= 21) and Scn8a KO CG cells (n= 15; P > 0.05). Circles indicate individual values and squares indicate mean values ±s.e.m. (WT: filled symbols; Snc8a CG KO: open symbols.) D, characteristic action potentials from WT (black line, P49) and Snc8a CG KO (grey line, P41) mice. Shown are the first recorded action potentials aligned at threshold. The WT action potential has a rise time of 0.35 ms, a peak amplitude of 31.3 mV and a half-width of 0.64 ms while the Snc8a CG KO action potential has a rise time of 0.29 ms, a peak amplitude of 32.0 mV and a half-width of 0.50 ms. E, action potential peak in CG cells from WT mice (+22.5 ± 2.0 mV, n= 23) and Snc8a CG KO mice (+21.2 ± 2.0 mV, n= 17) (P > 0.05). Open circles indicate individual values; filled squares indicate mean values ±s.e.m. F, action potential rise time (filled squares) in CG cells from WT mice (0.42 ± 0.02 ms, n= 23) and Snc8a CG KO mice (0.33 ± 0.01 ms, n= 16) and half-width (open squares) in CG cells from WT mice (0.67 ± 0.02 ms, n= 23) and Snc8a CG KO mice (0.51 ± 0.02 ms, n= 16). Open circles indicate individual values; filled squares indicate mean values ±s.e.m. G, postspike AHP amplitude in CG cells from WT mice (−71 ± 0.7 mV, n= 17) and Snc8a CG KO mice (−74.9 ± 0.8 mV, n= 23). Open circles indicate individual values; filled squares indicate mean values ±s.e.m. C, representative responses of CG cells from a WT (P45, left) and an Snc8a CG KO (P41, right) mice to increasing current injections. H, cumulative plot showing the difference in the distribution of the interspike intervals in WT (black line) and Snc8a KO CG cells (grey line) measured following a +40 pA current step (Kolmogorov–Smirnov test: P < 0.001). I, average mean firing rate plotted against current intensity for WT CG cells (filled squares, n= 23) and Snc8a KO CG cells (open squares, n= 17). Straight lines are linear regression fits to data points, giving slope coefficients of 1.72 and 1.16 Hz pA−1 for WT and Scn8a KO CG cells, respectively.

Similar articles

Cited by

References

    1. Afshari FS, Ptak K, Khaliq ZM, Grieco TM, Slater NT, McCrimmon DR, Raman IM. Resurgent Na currents in four classes of neurons of the cerebellum. J Neurophysiol. 2004;92:2831–2843. - PubMed
    1. Aller MI, Jones A, Merlo D, Paterlini M, Meyer AH, Amtmann U, Brickley S, Jolin HE, McKenzie AN, Monyer H, Farrant M, Wisden W. Cerebellar granule cell Cre recombinase expression. Genesis. 2003;36:97–103. - PubMed
    1. Aman TK, Raman IM. Subunit dependence of Na channel slow inactivation and open channel block in cerebellar neurons. Biophys J. 2007;92:1938–1951. - PMC - PubMed
    1. Astman N, Gutnick MJ, Fleidervish IA. Persistent sodium current in layer 5 neocortical neurons is primarily generated in the proximal axon. J Neurosci. 2006;26:3465–3473. - PMC - PubMed
    1. Berry MJ, 2nd, Meister M. Refractoriness and neural precision. J Neurosci. 1998;18:2200–2211. - PMC - PubMed

Publication types