. 2010 Mar;12(3):247-56.
doi: 10.1038/ncb2024. Epub 2010 Feb 21.

miR-9, a MYC/MYCN-activated microRNA, regulates E-cadherin and cancer metastasis

Affiliations

miR-9, a MYC/MYCN-activated microRNA, regulates E-cadherin and cancer metastasis

Li Ma et al. Nat Cell Biol. 2010 Mar.

Abstract

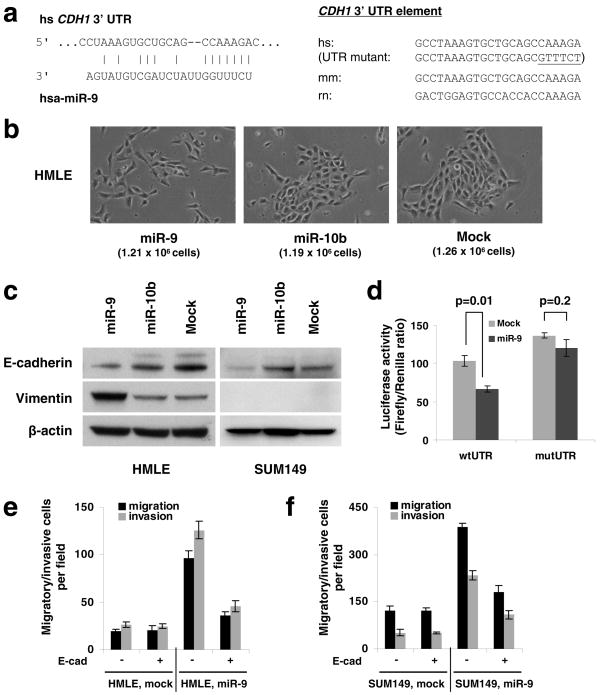
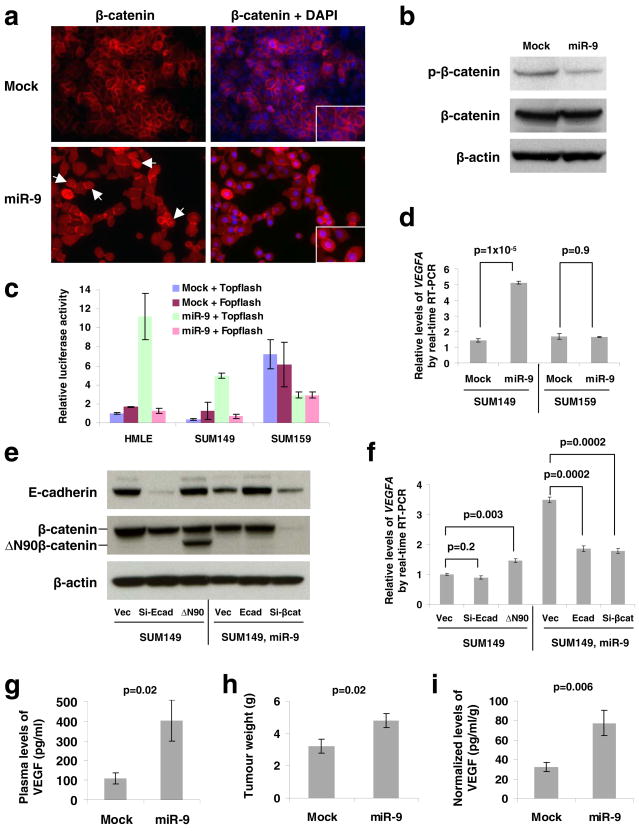
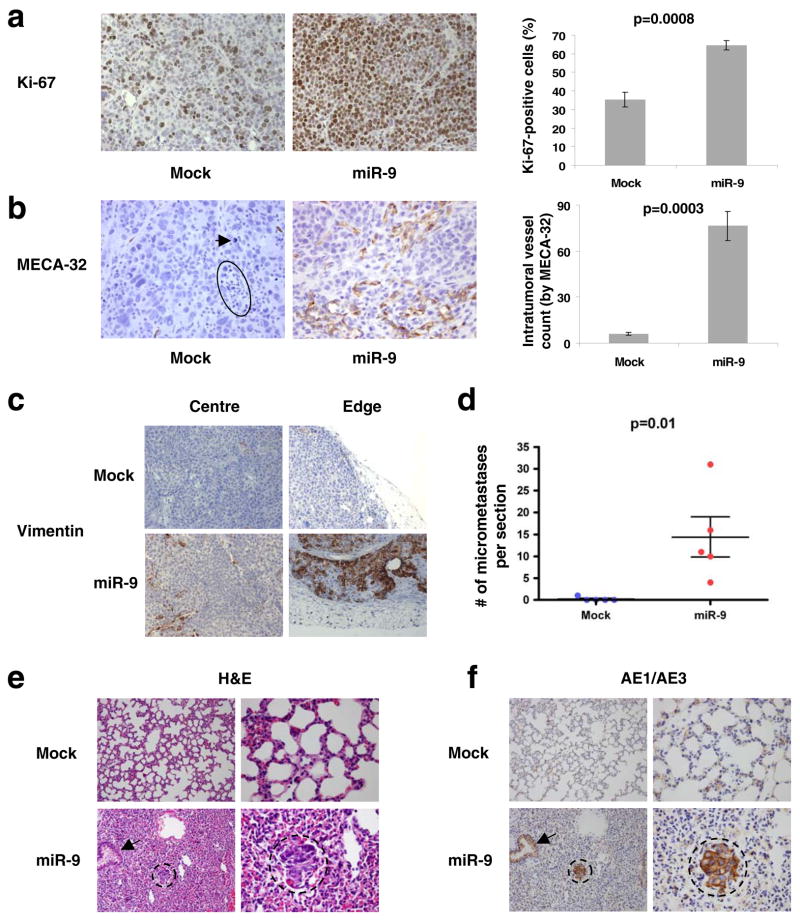
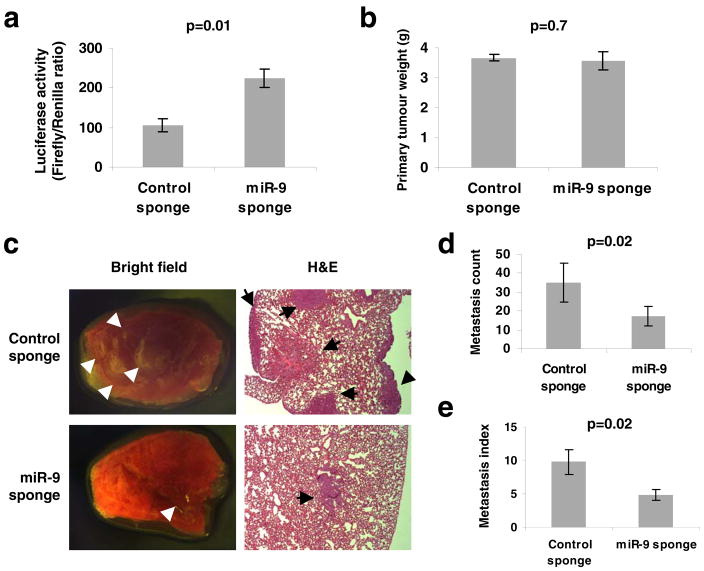
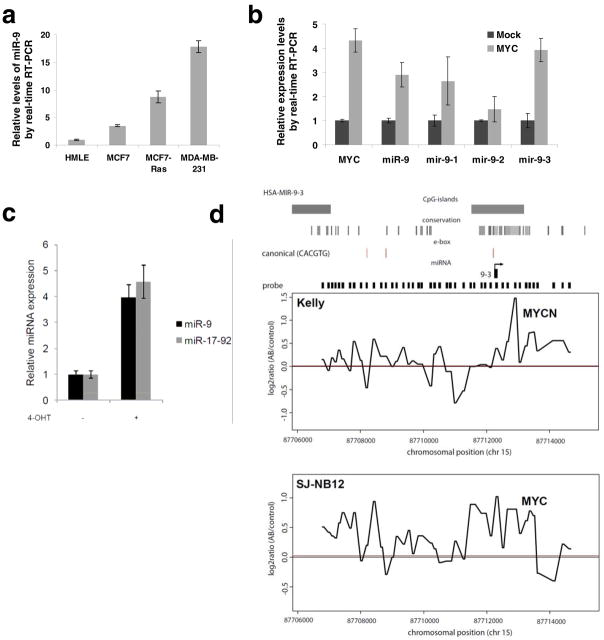
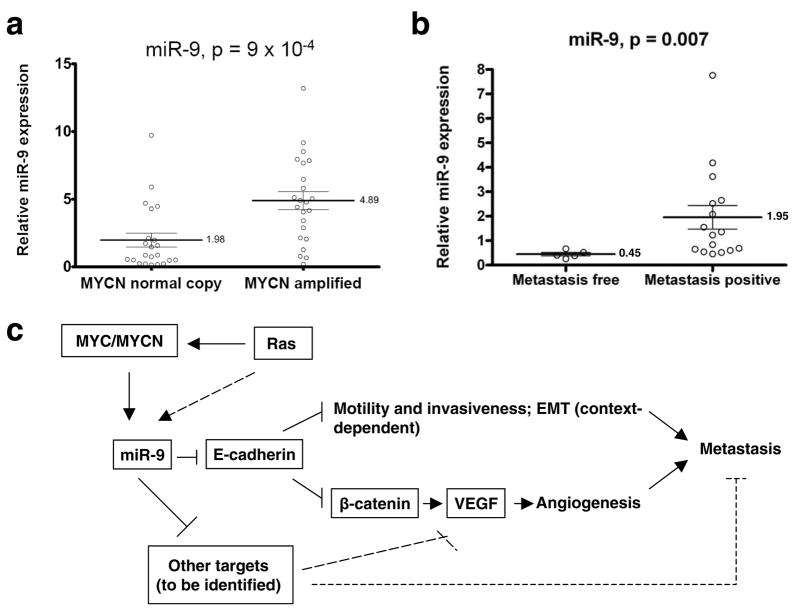
MicroRNAs (miRNAs) are increasingly implicated in regulating the malignant progression of cancer. Here we show that miR-9, which is upregulated in breast cancer cells, directly targets CDH1, the E-cadherin-encoding messenger RNA, leading to increased cell motility and invasiveness. miR-9-mediated E-cadherin downregulation results in the activation of beta-catenin signalling, which contributes to upregulated expression of the gene encoding vascular endothelial growth factor (VEGF); this leads, in turn, to increased tumour angiogenesis. Overexpression of miR-9 in otherwise non-metastatic breast tumour cells enables these cells to form pulmonary micrometastases in mice. Conversely, inhibiting miR-9 by using a 'miRNA sponge' in highly malignant cells inhibits metastasis formation. Expression of miR-9 is activated by MYC and MYCN, both of which directly bind to the mir-9-3 locus. Significantly, in human cancers, miR-9 levels correlate with MYCN amplification, tumour grade and metastatic status. These findings uncover a regulatory and signalling pathway involving a metastasis-promoting miRNA that is predicted to directly target expression of the key metastasis-suppressing protein E-cadherin.


Conflict of interest statement

COMPETING FINANCIAL INTERESTS

The authors declare no competing financial interests.

Figures

Figure 1
Figure 1. miR-9 directly targets CDH1 and increases cell motility and invasiveness
(a) Left panel: predicted duplex formation between human CDH1 3′UTR and miR-9. Right panel: sequence of the miR-9 binding site within the CDH1 3′UTR of human (hs), mouse (mm), and rat (rn). (b) Phase contrast images of HMLE cells infected with the miR-9-expressing, miR-10b-expressing, or empty vector. Cells were plated on 10 cm dishes at the same density (1 × 10⁶ cells in 10 ml medium). Two days after plating, images were taken and cells were then counted (cell numbers are shown in parentheses). Magnification: x200. (c) Immunoblotting of E-cadherin and vimentin in HMLE and SUM149 cells infected with the miR-9-expressing, miR-10b-expressing, or empty vector. (d) Luciferase activity of the wild-type or mutant CDH1 3′UTR reporter gene in SUM149 cells infected with the miR-9-expressing or empty vector. (e, f) Transwell migration assay and Matrigel invasion assay of miR-9-transduced or mock-infected HMLE (e) and SUM149 (f) cells with or without ectopic expression of E-cadherin. A representative experiment is shown in triplicate along with s.e.m. in df.
Figure 2
Figure 2. miR-9 increases VEGF levels in an E-cadherin- and β-catenin-dependent manner
(a) Immunofluorescence staining of β-catenin (red) in mock-infected or miR-9-expressing SUM149 cells demonstrates differential localization. Right panels are the overlay of β-catenin and nuclear 4′,6-diamidino-2-phenylindole (DAPI; blue) staining of the same field. White arrows indicate cells positive for nuclear β-catenin. Insets: blow-up images of particular cells. Magnification: x200. (b) Immunoblotting of phospho-β-catenin (Ser33/37/Thr41, GSK-3β phosphorylation sites) and β-catenin in SUM149 cells infected with the miR-9-expressing or empty vector. (c) Topflash reporter assay in HMLE, SUM149, and SUM159 cells infected with the miR-9-expressing or empty vector. (d) Real-time RT-PCR of total VEGFA mRNA in SUM149 and SUM159 cells infected with the miR-9-expressing or empty vector. (e) Immunoblotting of E-cadherin and β-catenin in SUM149 cells infected with E-cadherin siRNA (si-Ecad) or ΔN90β-catenin (ΔN90), and in SUM149-miR-9 cells infected with E-cadherin (Ecad) or β-catenin siRNA (si-βcat). Vec: the pLKO-puro vector with a scrambled sequence that does not target any mRNA. (f) Real-time RT-PCR of total VEGFA mRNA in the same cells described in e. A representative experiment is shown in triplicate along with s.e.m. in c, d and f. (gi) Plasma levels of VEGF (g), primary tumor weight (h), and normalized VEGF levels (i) in mice that received orthotopic injection of miR-9-transduced or mock-infected SUM149 cells, at week 12 after transplantation. Data are presented as mean ± s.e.m. (n = 8 mice per group).
Figure 3
Figure 3. miR-9 induces angiogenesis, mesenchymal marker expression, and metastasis of the SUM149 epithelial tumors
(a, b) Left panels: Ki-67- (a) and MECA-32-stained sections (b) of primary mammary tumors formed by mock-infected or miR-9-transduced SUM149 cells, at week 12 after orthotopic transplantation. The circle and arrow indicate pyknotic nuclei. Magnification: x200 for Ki-67; x400 for MECA-32. Right panels: counting of Ki-67-positive cells (a) and intratumoral vessels (the number of microvessels per field, b). Data are presented as mean ± s.e.m. (we counted three fields per section and analyzed four mice per group). (c) Human-specific vimentin staining of primary mammary tumors formed by mock-infected or miR-9-transduced SUM149 cells, at week 12 after orthotopic transplantation. Both intratumoral regions (center) and tumor-stroma interfaces (edge) are shown. Magnification: x200. n = 3 mice per group were analyzed for vimentin. (d) Numbers of lung micrometastases per section in individual mice that received orthotopic injection of miR-9-transduced or mock-infected SUM149 cells, at week 12 after transplantation. Data are presented as mean ± s.e.m. (each data point represents a different mouse; n = 5 mice per group). (e, f) H&E- (e) and AE1/AE3 (a cocktail of two distinct anti-cytokeratin monoclonal antibodies, f)-stained sections of lungs isolated from mice that received orthotopic injection of miR-9-transduced or mock-infected SUM149 cells, at week 12 after transplantation. Circles indicate clusters of micrometastatic cells. Arrows indicate normal bronchial epithelium. Magnification: x200 in left columns; x600 in right columns.
Figure 4
Figure 4. Inhibiting miR-9 suppresses metastasis
(a) Enhanced activity of miR-9-regulated reporter by infection of 4T1 cells with the miR-9 sponge. A representative experiment is shown in triplicate along with s.e.m. (b) Primary tumor weight in Balb/c mice that received orthotopic injection of 4T1 cells infected with the miR-9 sponge or control sponge, at 4 weeks after transplantation. (c) Bright field imaging and H&E staining of lungs isolated from mice that received orthotopic injection of 4T1 cells infected with the miR-9 sponge or control sponge, at 4 weeks after transplantation. Arrows indicate metastatic nodules. Magnification: x8 for bright field imaging; x40 for H&E staining. (d, e) Numbers of visible lung metastases (d) and metastasis index (= number of metastases/primary tumor weight, e) in mice that received orthotopic injection of 4T1 cells infected with the miR-9 or control sponge, at 4 weeks after transplantation. Data in b, d and e are presented as mean ± s.e.m. (n = 8 mice per group).
Figure 5
Figure 5. miR-9 expression is activated by MYC/MYCN
(a) Real-time RT-PCR of miR-9 in HMLE, MCF7, MCF7-RAS, and MDA-MB-231 cells. (b) Real-time RT-PCR of MYC, mature miR-9, mir-9-1, mir-9-2, and mir-9-3 in mock-infected or MYC-transduced HMLE cells. (c) Mature miRNA expression in SH-EP-MYCN-ER cells upon MYCN induction with 4-OHT, 48 h after treatment. MiRNA expression values were rescaled relative to the control (no 4-OHT). The miR-17-92 expression value represents the expression of miR-20a, a miRNA residing within the miR-17-92 cluster representative for miR-17-92 expression. Data in ac are presented as mean ± s.e.m. of triplate samples. (d) ChIP-on-chip data showing occupancy of the mir-9-3 genomic sequence by MYCN and MYC in Kelly (MYCN-amplified) and SJ-NB-12 (MYC-amplified) neuroblastoma cells, respectively. The genomic positions for probes and their enrichment ratios are displayed on the X and Y axes, respectively. Smoothed local enrichment ratios are given for either MYCN or MYC at the mir-9-3 locus in Kelly and SJ-NB-12 cells. The red line indicates median enrichment ratio for MYCN or MYC versus input as calculated of all probes for chromosome 15.
Figure 6
Figure 6. miR-9 levels correlate with MYCN amplification and metastatic status in human cancers
(a) Expression of mature miR-9 in MYCN-normal copy (n = 22) and MYCN-amplified (n = 23) neuroblastoma tumor samples. (b) Expression of mature miR-9 in primary breast tumor samples from metastasis-free and metastasis-positive patients. Data in a and b are presented as mean ± s.e.m. (c) Model for miR-9-mediated pathway in cancer metastasis.

Comment in

Similar articles

Cited by

References

    1. Fidler IJ. The pathogenesis of cancer metastasis: the ‘seed and soil’ hypothesis revisited. Nat Rev Cancer. 2003;3:453–8. - PubMed
    1. Thiery JP. Epithelial-mesenchymal transitions in tumour progression. Nat Rev Cancer. 2002;2:442–54. - PubMed
    1. Nicoloso MS, Spizzo R, Shimizu M, Rossi S, Calin GA. MicroRNAs--the micro steering wheel of tumour metastases. Nat Rev Cancer. 2009;9:293–302. - PubMed
    1. Ma L, Weinberg RA. Micromanagers of malignancy: role of microRNAs in regulating metastasis. Trends Genet. 2008;24:448–56. - PubMed
    1. Bartel DP. MicroRNAs: genomics, biogenesis, mechanism, and function. Cell. 2004;116:281–97. - PubMed

Publication types

MeSH terms