. 2010 Mar;12(3):235-46.
doi: 10.1038/ncb2023. Epub 2010 Feb 21.

Consolidation of the cancer genome into domains of repressive chromatin by long-range epigenetic silencing (LRES) reduces transcriptional plasticity

Affiliations

Consolidation of the cancer genome into domains of repressive chromatin by long-range epigenetic silencing (LRES) reduces transcriptional plasticity

Marcel W Coolen et al. Nat Cell Biol. 2010 Mar.

Abstract

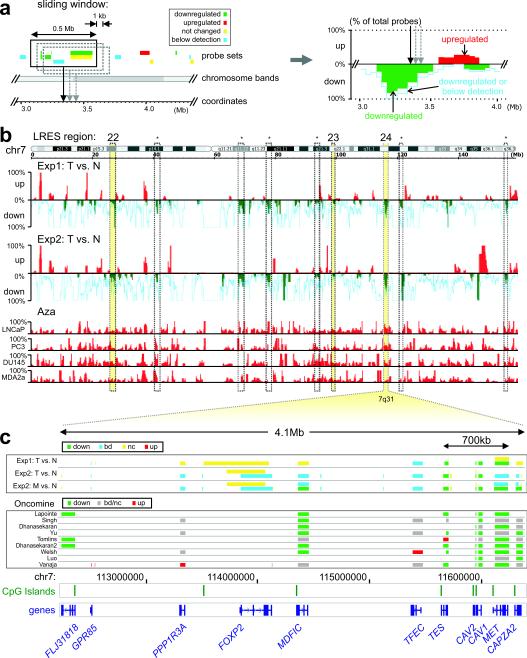
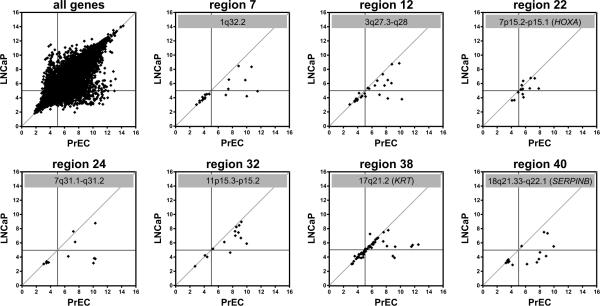
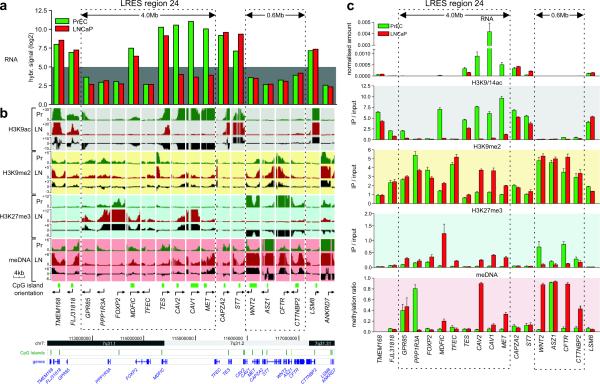
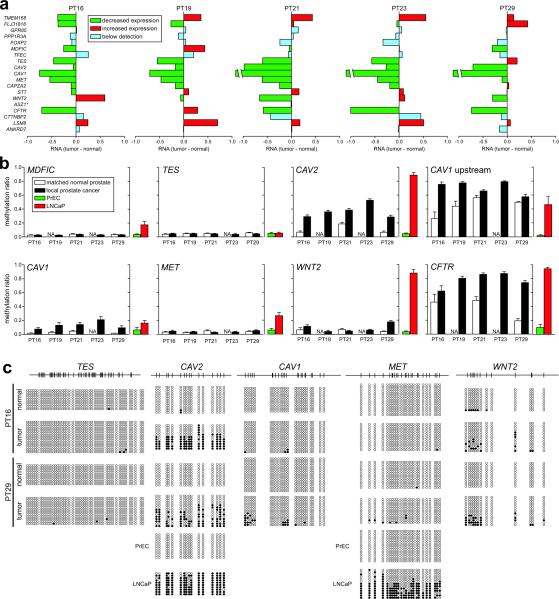
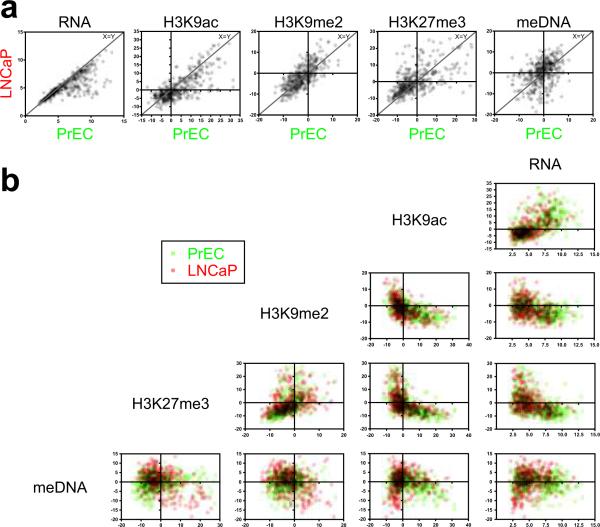
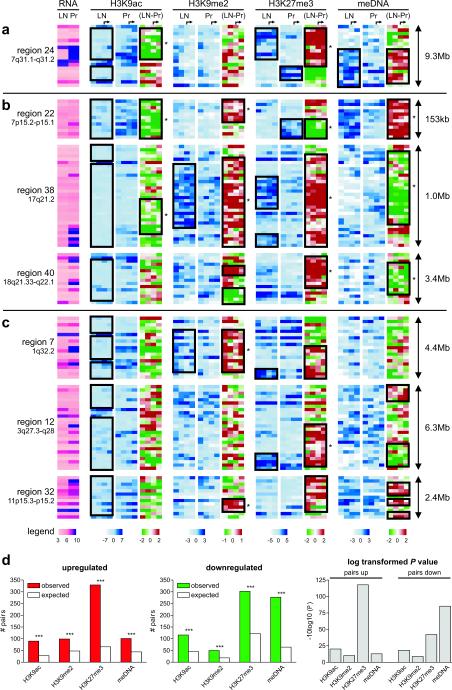
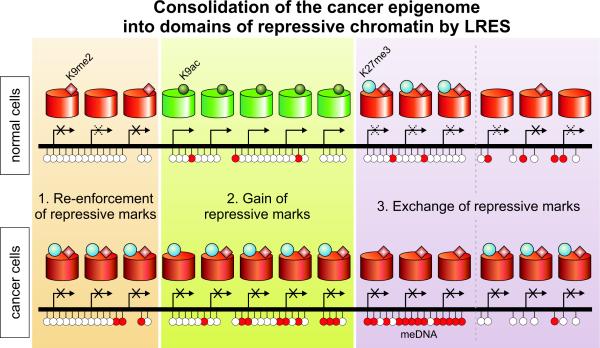
Silencing of individual genes can occur by genetic and epigenetic processes during carcinogenesis, but the underlying mechanisms remain unclear. By creating an integrated prostate cancer epigenome map using tiling arrays, we show that contiguous regions of gene suppression commonly occur through long-range epigenetic silencing (LRES). We identified 47 LRES regions in prostate cancer, typically spanning about 2 Mb and harbouring approximately 12 genes, with a prevalence of tumour suppressor and miRNA genes. Our data reveal that LRES is associated with regional histone deacetylation combined with subdomains of different epigenetic remodelling patterns, which include re-enforcement, gain or exchange of repressive histone, and DNA methylation marks. The transcriptional and epigenetic state of genes in normal prostate epithelial and human embryonic stem cells can play a critical part in defining the mode of cancer-associated epigenetic remodelling. We propose that consolidation or effective reduction of the cancer genome commonly occurs in domains through a combination of LRES and LOH or genomic deletion, resulting in reduced transcriptional plasticity within these regions.


Figures

Fig. 1
Fig. 1. Sliding window analysis on public expression microarray data
(a) For each dataset a computational sliding window algorithm was used to move along the genome in 1kb increments, recording the percentages of down-regulated, up-regulated and below detection probes within a 500kb region. The percentages were plotted along the genome for visual display (right panel; green bars: % down-regulated probes; red bars: % upregulated probes; light blue line: % probes down or below detection). (b) Sliding window analysis display for chromosome 7. Initially, nine regions (dashed columns) were identified on this chromosome with concordant down-regulation in both experimental datasets (Exp1: tumour (T) vs Normal (N); Exp2: tumour (T) vs Normal (N)68). Results were combined with expression studies on 5-Aza-dC (Aza) treated prostate cancer cell lines to examine potential epigenetic repression. The numbered yellow columns show regions with LRES potential: four or more consecutively repressed genes and no up-regulated probe sets in the clinical samples, plus evidence of up-regulation after 5-Aza-dC treatment in the cell line samples: region 22 (7p15.2-p15.1) containing the HOXA cluster, region 23 (7q22.1) with several cytochrome P450 (CYP) and zinc finger (ZNF) genes, and region 24 (7q31.1-q31.2) which 11 genes including CAV1 and CAV2. Dashed columns indicated with an asterisk are regions that were discarded from further analysis as they contain only one or two genes (large genes with multiple probe sets) and/or did not show any upregulation in the 5-Aza-dC experiments. (c) Gene suppression at each probe set is displayed across the 4.1 Mb region spanning 7q31 for experiments 1 and 2 (T vs N) and metastatic (M) versus normal (N) prostate is displayed separately for experiment 2. Gene suppression at each probe set is also shown for nine large Oncomine studies where local prostate cancer was compared with normal prostate samples. Location of the genes and CpG islands and chromosome coordinates are indicated below for region 24.
Fig. 2
Fig. 2. Expression status of LRES regions in PrEC and LNCaP cells
RNA samples of normal prostate epithelial cells (PrEC) and the prostate cancer cell line LNCaP were analysed on Gene 1.0ST microarrays and all hybridisation signals (log2) were plotted as scatter plots (top left panel). The horizontal and vertical lines in each panel indicate the detection thresholds (hybridisation signal below 5.0), while the line x = y indicates equal transcripts levels in PrEC and LNCaP cells. Scatter plots are shown for seven example LRES regions, identified from clinical prostate cancer samples that also display concordant gene suppression in LNCaP cells.
Fig. 3
Fig. 3. Epigenetic landscape of 7q31.1-q31.2 in LNCaP and PrEC cells
(a) Expression analysis of LRES region 24 (7q31.1-q31.2) in LNCaP and PrEC cells by microarray hybridisation signals. The grey background highlights signals below detection (hybridisation signal below 5.0). (b) H3K9ac, H3K9me2, H3K27me3 histone modification and DNA methylation was analysed using Affymetrix GeneChip human promoter 1.0R tiling arrays. For each gene and each modification, the enrichment over input status is shown as well as the differential pattern (Pr [green tracks]: PrEC; LN [red tracks]: LNCaP; Δ [black tracks]: LNCaP minus PrEC). The dotted boxes highlight repressed domains that show distinct reorganisation of chromatin modifications and DNA methylation corresponding to the more silent state across the LRES region 24 of 4.0Mb from GPR85 to MET. The boundary genes TMEM168, FLJ31818, CAPZA2 and ST7 do not gain repressive marks and show high levels of K9 acetylation in both cell lines. A downstream region of 600 kb is also shown, covering WNT2, ASZ1, CFTR and CTTNBP2. This region is already silent in PrEC but is remodelled in LNCaP with a loss of H3K27me3 and a gain in DNA methylation. Genomic information of the region was taken from UCSC Genome Browser. (c) Validation of the tiling array results. Real-time qPCR was used to validate gene expression and ChIP-on-chip results, while Sequenom DNA methylation analysis was used to validate the MeDIP-on-chip results. Results of triplicate experiments are shown (average plus S.E.M.).
Fig. 4
Fig. 4. Epigenetic suppression of 7q31.1–q31.2 in clinical prostate cancer samples
(a) Gene expression changes for genes within LRES region 24 in five pairs of local prostate cancer and adjacent normal tissue. Reduced expression of consecutive genes in individual clinical samples across the LRES region 24, from Experiment Set 1; (green: reduced expression; red: increased expression; blue: below detection [log2 signal < 5.0]; *: ASZ1 was not interrogated on these expression arrays.) (b) Quantitative DNA methylation Sequenom MALDI-TOF analysis of genomic DNA from the same clinical samples. Average methylation ratios across the interrogated regions are shown. For comparison, the average methylation ratios for PrEC and LNCaP cells are also graphed. It can be clearly seen that within a sample, multiple genes within the region are DNA hypermethylated, e.g. in patient 29 (PT29) hypermethylation was observed in the CAV2, CAV1, WNT2 and CFTR promoters. CAV1 upstream is a genomic region immediately upstream of the CpG island in the promoter of the CAV1 gene. (c) DNA methylation levels in two clinical samples, patient 16 (PT16) and 29 (PT29), were further interrogated by clonal bisulphite methylation sequencing. Black and white circles indicate methylated and unmethylated CpG sites respectively and each row represents a clone. The CAV2, CAV1 and WNT2 promoters showed signs of hypermethylation in both cancer samples while TES and MET were essentially unmethylated. For comparison, clonal bisulphite sequencing results are shown for CAV2 and MET in PrEC and LNCaP cells.
Fig. 5
Fig. 5. Scatter plots of epigenetic marks in all LRES genes
RNA signals, as well as summarised ChIP and MeDIP signals were compared for all LRES genes. (For each gene, the sum was determined of the MAT scores at −2kb, −1kb, TSS and +1kb relative to its transcription start site. Transparent data points are shown and overlaying signals have been multiplied to facilitate a comprehensive interpretation.) (a) Scatter plots comparing RNA, H3K9ac, H3K9me2, H3K27me3 and DNA methylation (meDNA) signals in PrEC and LNCaP cells. Data points close to the line x = y reflect genes that have not changed their mark between the cell lines. A Wilcoxon signed rank test indicated significant depletions in RNA and H3K9ac signals in LNCaP compared to PrEC cells, while H3K27me3 and meDNA levels were overall increased (all P values were <0.0005). (b) Matrix scatter plots of signals within each cell line (PrEC cells: green; LNCaP cells: red). H3K9ac signals are high when RNA levels are high. H3K9me2 and H3K27me3 signal are only high when H3K9ac or RNA levels are low or off. H3K9me2 and H3K27me3 reveal a positive correlation, while especially in LNCaP genes H3K27me3 and DNA methylation signal show a negative correlation. Horizontal and vertical lines in each plot indicate y = 0 and x = 0, respectively.
Fig. 6
Fig. 6. Epigenetic changes in LRES regions cluster in domains of consecutive genes
Heatmaps of epigenetic features within seven example LRES regions in LNCaP and PrEC cells show blocks of conserved changes: (a) region 24 on 7q31.1–q31.2; (b) three LRES regions containing gene families: region 22 (HOXA), region 38 (KRT) and region 40 (SERPINB), and (c) three LRES regions without any gene families: regions 7, 12 and 32, respectively. Each row in the graphs represents a single gene with the genes sorted based on their chromosomal coordinates (5′ to 3′). For simplicity reasons, MAT scores are shown at fixed intervals from the transcription start site (−2000, −1000, 0, + 1000bp) with the arrows on top indicating the start of transcription. Colour legends are shown below panel (c). The black boxes are highlighting consecutive genes that display the same epigenetic profile or epigenetic mark change and asterisks demark significant domains of similar changes (Wald-Wolfowitz test; P < 0.05). (d) Epigenetic changes cluster throughout the cancer genome. Statistical analysis of the number of adjacent gene pairs in the genome that display the same epigenetic change revealed that clustering occurs much more frequently than by chance (***: P < 1*10−09 or −10log10(P) > 9; see Supplementary Material and Methods for details). Clustering occurs for all epigenetic marks interrogated and in both directions implicating a deregulation of the cancer epigenome into domains that include multiple genes (up-regulation: left graph; down-regulation: middle graph; log transformed P values for changes: right graph).
Fig. 7
Fig. 7. Consolidation of the cancer epigenome into domains of repressive chromatin by LRES
Within LRES regions in cancer – but also throughout the rest of the cancer genome – epigenetic changes frequently occur in domains of consecutive genes. Three types of domains can be identified: (1) Repressive marks can be re-enforced to a more definitively repressed state. Complete repression of such a region is frequently marked with a gain of H3K27 trimethylation and sporadic DNA hypermethylation. (2) A gain of (multiple) repressive marks is often observed in regions that were clearly active and associated with H3K9 hyperacetylation in the normal state. (3) An exchange of repressive marks, either from H3K27me3 to DNA methylation or the inverse is seen for regions that display only low expression levels in normal cells.

References

    1. Jones PA, Baylin SB. The epigenomics of cancer. Cell. 2007;128:683–692. - PMC - PubMed
    1. Baylin SB, et al. Aberrant patterns of DNA methylation, chromatin formation and gene expression in cancer. Human molecular genetics. 2001;10:687–692. - PubMed
    1. Bird AP, Wolffe AP. Methylation-induced repression - Belts, braces, and chromatin. Cell. 1999;99:451–454. - PubMed
    1. Jones PA, Laird PW. Cancer epigenetics comes of age. Nature genetics. 1999;21:163–167. - PubMed
    1. Lund AH, van Lohuizen M. Epigenetics and cancer. Genes & development. 2004;18:2315–2335. - PubMed

Publication types

MeSH terms