Adult-born SVZ progenitors receive transient synapses during remyelination in corpus callosum
- PMID: 20173746
- PMCID: PMC4681435
- DOI: 10.1038/nn.2500
Adult-born SVZ progenitors receive transient synapses during remyelination in corpus callosum
Abstract
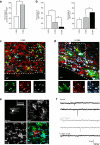
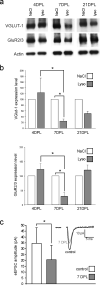
We found that demyelinated axons formed functional glutamatergic synapses onto adult-born NG2(+) oligodendrocyte progenitor cells (OPCs) migrating from the subventricular zone after focal demyelination of adult mice corpus callosum. This glutamatergic input was substantially reduced compared with endogenous callosal OPCs 1 week after lesion and was lost on differentiation into oligodendrocytes. Therefore, axon-oligodendrocyte progenitor synapse formation is a transient and regulated step that occurs during remyelination of callosal axons.
Figures


Similar articles
-
Demyelination Produces a Shift in the Population of Cortical Neurons That Synapse with Callosal Oligodendrocyte Progenitor Cells.eNeuro. 2025 Jun 12;12(6):ENEURO.0113-25.2025. doi: 10.1523/ENEURO.0113-25.2025. Print 2025 Jun. eNeuro. 2025. PMID: 40345851 Free PMC article.
-
Adult neural precursor cells from the subventricular zone contribute significantly to oligodendrocyte regeneration and remyelination.J Neurosci. 2014 Oct 15;34(42):14128-46. doi: 10.1523/JNEUROSCI.3491-13.2014. J Neurosci. 2014. PMID: 25319708 Free PMC article.
-
Neural Stem Cells of the Subventricular Zone Contribute to Neuroprotection of the Corpus Callosum after Cuprizone-Induced Demyelination.J Neurosci. 2019 Jul 10;39(28):5481-5492. doi: 10.1523/JNEUROSCI.0227-18.2019. Epub 2019 May 28. J Neurosci. 2019. PMID: 31138656 Free PMC article.
-
The role of oligodendrocytes and oligodendrocyte progenitors in CNS remyelination.Adv Exp Med Biol. 1999;468:183-97. doi: 10.1007/978-1-4615-4685-6_15. Adv Exp Med Biol. 1999. PMID: 10635029 Review.
-
Physiology of Oligodendroglia.Adv Exp Med Biol. 2019;1175:117-128. doi: 10.1007/978-981-13-9913-8_5. Adv Exp Med Biol. 2019. PMID: 31583586 Review.
Cited by
-
Early life adversity targets the transcriptional signature of hippocampal NG2+ glia and affects voltage gated sodium (Nav) channels properties.Neurobiol Stress. 2021 May 14;15:100338. doi: 10.1016/j.ynstr.2021.100338. eCollection 2021 Nov. Neurobiol Stress. 2021. PMID: 34095364 Free PMC article.
-
Contribution of the oligodendrocyte lineage to CNS repair and neurodegenerative pathologies.Neuropharmacology. 2016 Nov;110(Pt B):539-547. doi: 10.1016/j.neuropharm.2016.04.026. Epub 2016 Apr 21. Neuropharmacology. 2016. PMID: 27108096 Free PMC article. Review.
-
Divergence between Neuronal and Oligodendroglial Cell Fate, in Postnatal Brain Neural Stem Cells, Leads to Divergent Properties in Polymorphic In Vitro Assays.Cells. 2022 May 25;11(11):1743. doi: 10.3390/cells11111743. Cells. 2022. PMID: 35681436 Free PMC article.
-
Micropillar arrays as a high-throughput screening platform for therapeutics in multiple sclerosis.Nat Med. 2014 Aug;20(8):954-960. doi: 10.1038/nm.3618. Epub 2014 Jul 6. Nat Med. 2014. PMID: 24997607 Free PMC article.
-
N-cadherin promotes recruitment and migration of neural progenitor cells from the SVZ neural stem cell niche into demyelinated lesions.J Neurosci. 2014 Jul 16;34(29):9590-606. doi: 10.1523/JNEUROSCI.3699-13.2014. J Neurosci. 2014. Retraction in: J Neurosci. 2023 Dec 13;43(50):8827. doi: 10.1523/JNEUROSCI.2046-23.2023. PMID: 25031401 Free PMC article. Retracted.
References
-
- Gensert JM, Goldman JE. Neuron. 1997;19:197–203. - PubMed
-
- Nait-Oumesmar B, Decker L, Lachapelle F, Avellana-Adalid V, Bachelin C, Van Evercooren AB. Eur. J. Neurosci. 1999;11:4357–4366. - PubMed
-
- Aguirre A, Dupree J, Mangin JM, Gallo V. Nat. Neurosci. 2007;10:990–1002. - PubMed
-
- Kukley M, Capetillo-Zarate E, Dietrich D. Nat. Neurosci. 2007;10:311–320. - PubMed
Publication types
MeSH terms
Substances
Grants and funding
LinkOut - more resources
Full Text Sources
Molecular Biology Databases

