

doi: 10.1038/nchembio.321.
Epub 2010 Feb 21.
Two-photon uncaging of gamma-aminobutyric acid in intact brain tissue
Affiliations
- PMID: 20173751
- PMCID: PMC4104925
- DOI: 10.1038/nchembio.321
Item in Clipboard
Two-photon uncaging of gamma-aminobutyric acid in intact brain tissue
Nat Chem Biol.
2010 Apr.
Abstract
We have synthesized a photosensitive (or caged) 4-carboxymethoxy-5,7-dinitroindolinyl (CDNI) derivative of gamma-aminobutyric acid (GABA). Two-photon excitation of CDNI-GABA produced rapid activation of GABAergic currents in neurons in brain slices with an axial resolution of approximately 2 mum and enabled high-resolution functional mapping of GABA-A receptors. Two-photon uncaging of GABA, the main inhibitory neurotransmitter, should allow detailed studies of receptor function and synaptic integration with subcellular precision.
Figures
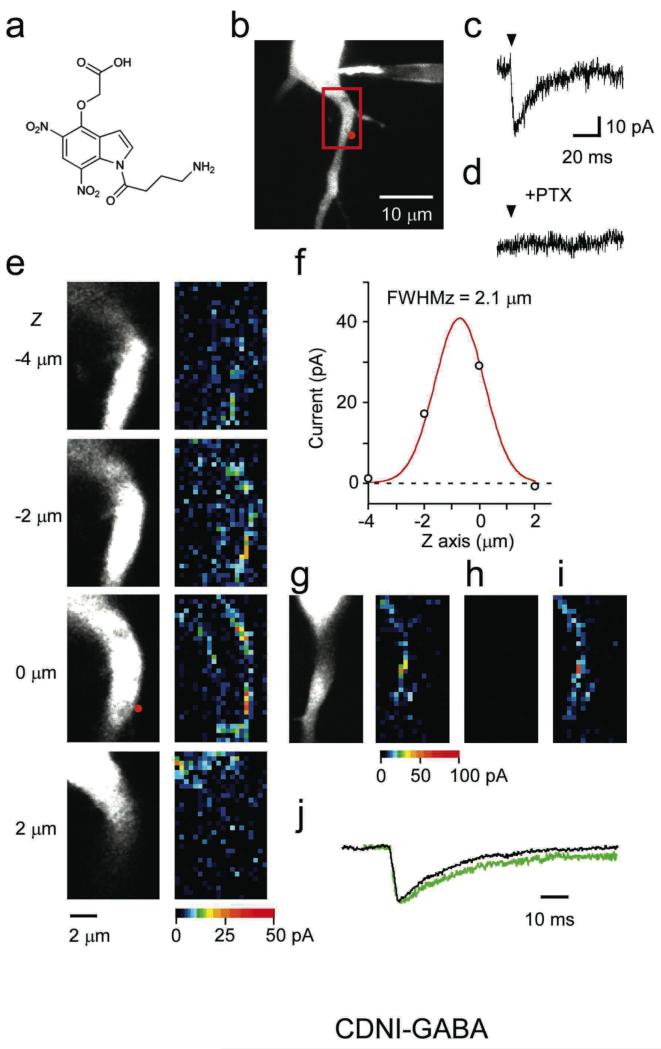
(a) Structure of CDNI-GABA. (b) A fluorescent image of a CA1 pyramidal neuron filled with Alexa-594 dye. The red-boxed region was mapped in (e). (c) Irraidation (6.3 mW, 1 ms, arrow) of CDNI-GABA (1.35 mM, puffed from a pipette close to the surface of the brain slice ) evoked a rapid current trace (2pIPSC) recorded from the pixel indicated by the red dot in (b). (d) Current trace from the same pixel in the presence of PTX. (e) The perisomatic area (red box in b) was subjected to 2P functional mapping in four planes (left), the evoked currents (right) from each pixel (grid of 16×32) is shown on a pseudo-color scale (bottom). (f) Amplitudes of 2pIPSCs (circles) at the pixels corresponding to the red point shown in (e) at each Z-axis. The smooth red line represents Gaussian fitting of the data. (g) Mapping of functional GABA-A responses (right) across a dendritic surface (left) using femtosecond pulses from a mode-locked Ti:sapphire laser. (h) Mapping the same region with the same laser in continuous-wave mode (non-mode locked) with the same power. (i) Restoration of mode-lock reproduced the functional map shown in (g). (j) Comparison of the average of 66 2pIPSCs with peak amplitudes of > 10 pA (selected from the mapping shown in (e) at Z-axis of 0 μm) with the average of 24 spontaneous mIPSCs whose peak amplitudes were > 10 pA recorded from the same neuron. The peak amplitudes were normalized.
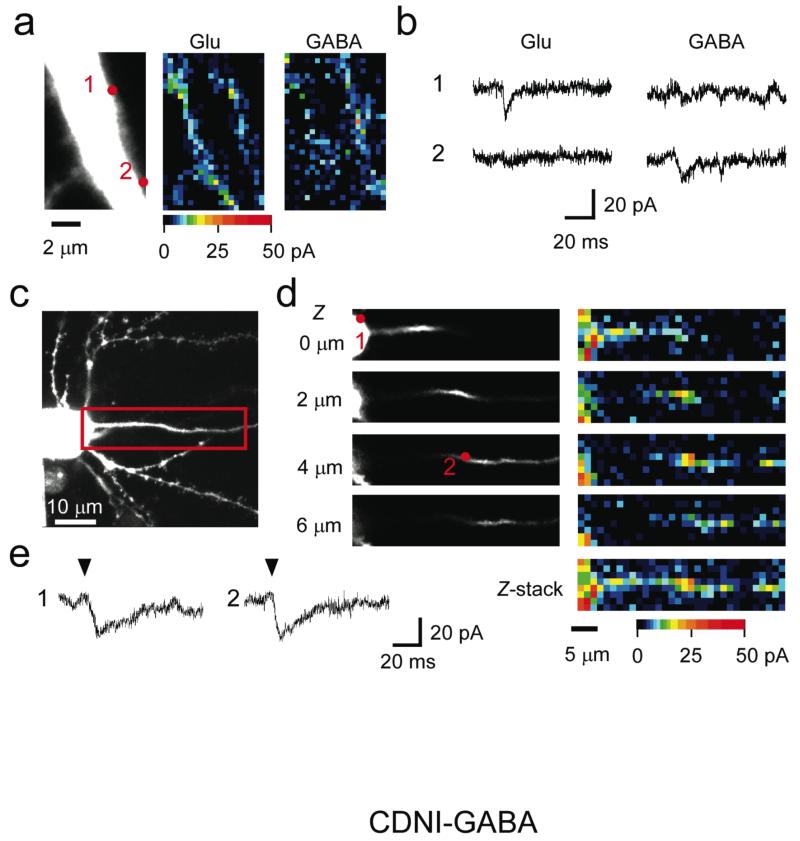
(a) Left: Z-stacked fluorescent image of a CA1 pyramidal neuron filled with Alexa-594 dye. First, 10 mM MNI-Glu was puffed from the glass pipette onto the slice surface and functional mapping of glutamate responses was performed (middle), then 1.35 mM CDNI-GABA was locally applied for functional mapping of GABA-R (right). The laser intensity in (a) was 3.9 mW and 6.3 mW for 2P uncaging of MNI-Glu and CDNI-GABA, respectively. The illumination time was 1 ms per pixel. (b) The induced currents at the numbered red dots in (a). (c) A Z-stacked fluorescent image of a CA1 pyramidal neuron filled with Alexa-594 dye. The red-boxed region was mapped by 2P uncaging (9.8 mW, 2ms per pixel) of 1.35 mM CDNI-GABA. The neuronal structure within the red box did not have any spine structure and projected to distal sites beyond the red box. Thus this structure represents the AIS. (d) Three dimensional mapping of functional GABA receptors on the AIS. Left panels show the structure of the AIS at four focal planes, while right panels show the GABA responses at the four planes. Right bottom panel shows the Z-stacked map by max-intensity projection. GABA responses at the numbered red dots (1: soma; 2: AIS) are shown in (e). Arrows indicate the time of illumination and the pseudo-color scales indicate the amplitude of corresponding responses..
References
Publication types
MeSH terms
Substances
Associated data
Grants and funding
LinkOut - more resources
Full Text Sources
Other Literature Sources
