. 2010 Feb 1;18(3):2477-94.
doi: 10.1364/OE.18.002477.

Quantitative cerebral blood flow with optical coherence tomography

Affiliations

Quantitative cerebral blood flow with optical coherence tomography

Vivek J Srinivasan et al. Opt Express. .

Abstract

Absolute measurements of cerebral blood flow (CBF) are an important endpoint in studies of cerebral pathophysiology. Currently no accepted method exists for in vivo longitudinal monitoring of CBF with high resolution in rats and mice. Using three-dimensional Doppler Optical Coherence Tomography and cranial window preparations, we present methods and algorithms for regional CBF measurements in the rat cortex. Towards this end, we develop and validate a quantitative statistical model to describe the effect of static tissue on velocity sensitivity. This model is used to design scanning protocols and algorithms for sensitive 3D flow measurements and angiography of the cortex. We also introduce a method of absolute flow calculation that does not require explicit knowledge of vessel angles. We show that OCT estimates of absolute CBF values in rats agree with prior measures by autoradiography, suggesting that Doppler OCT can perform absolute flow measurements in animal models.


Figures

Fig. 1
Fig. 1
Schematic of the OCT system. (a) The optical path incorporates two steering mirrors (M1 and M2) in the beam path to achieve precise alignment of the OCT beam. (b) Zoom of the focal plane of the objective lens showing a point scatterer emitting a spherical wave. This model is used in the derivation of the point spread function. (c) Schematic of two adjacent axial scans showing how transverse scanning can lead to a Doppler shift if the axis of light propagation (green arrow) is not aligned perpendicular to the scanning direction (red arrow). Mirrors M1 and M2 were used to correct for this effect, ensuring accurate Doppler measurements and reduced phase noise. (d) Summary of parameters for scanning protocols.
Fig. 5
Fig. 5
Procedure for calculating flow without explicit calculation of vessel angle. (a) Blood vessels can be oriented at any angle φ relative to the incident light. (b) The area of the vessel in the en face (xy) transverse plane is inversely proportional to cos(φ). (c) En face cut through a 3D OCT velocity projection volume (obtained by averaging all 10 volumes in Protocol 1) at a depth of 50 µm. (d) Zoom of a venule showing the z projection of velocity over the vessel cross-section (upsampled to reduce pixellation). While the area of the vessel in the xy plane is inversely proportional to cos(φ) the z-projection of the velocity is proportional to cos(φ).
Fig. 7
Fig. 7
Absolute values of flow measurements in the rat cortex in ascending venules. (a) Locations for flow measurements ( Media 1) and (b) absolute flow measurements at the designated locations. Standard errors over 10 repeated measurements are shown.
Fig. 6
Fig. 6
(a) OCT maximum intensity projection (MIP) angiogram of the rat somatosensory cortex showing comprehensive visualization of the vasculature at 12.0 µm transverse resolution. (b) zoom of arterial anasthmosis, showing visualization of surface vessels as well as capillaries below. (c) OCT MIP angiogram acquired with a 3.6 µm transverse resolution in a different animal. The transverse scanning speed was chosen to yield identical temporal power spectral densities at both resolutions. The apparent diameter of capillaries is increased as the transverse resolution is increased. In addition, due to the smaller depth of field, fewer vessels are visualized in the high transverse resolution MIP angiogram (c).
Fig. 2
Fig. 2
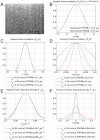
Slower scanning speeds improve frequency sensitivity by decreasing the width of the power spectral density of static tissue. (a) Image of scattering phantom used for autocorrelation and power spectral density measurements. (b) Measured and theoretical spatial autocorrelation functions. The theoretical spatial autocorrelation function was calculated by assuming the complex speckle pattern is formed by spatially uncorrelated (white) noise filtered by the point spread function in the focal plane. (c) Spatial autocorrelation functions at different scanning speeds are virtually identical. (d) Temporal autocorrelation functions at different scanning speeds show width inversely proportional to the scanning speed. (e) Spatial power spectral density at different scanning speeds are virtually identical. (f) Temporal power spectral densities at different scanning speeds show width proportional to the scanning speed.
Fig. 3
Fig. 3
. High-pass filtering was performed along the transverse direction to separate moving and stationary scatterers. (a) Real-valued filter kernel used for high-pass filtering and (b) Fourier transform of the filter kernel, or frequency response, for protocol 1 (0.95 µm / axial scan). (c) Filter kernel and (d) frequency response for protocol 2 (0.025 µm / axial scan).
Fig. 4
Fig. 4
. Digital high-pass filtering results in a Doppler mean frequency bias. Comparison of power spectral densities for protocol 1 (a-b) and protocol 2 (c-d) before and after digital high-pass filtering. The input center frequencies (0.0, 1.5, 3.0, 4.5, 6.0 kHz) are color coded as shown in the legends. Power spectral densities before and after high-pass filtering are shown as dotted and solid lines, respectively. The only source of decorrelation is assumed to be transverse scanning of the OCT beam. The mean frequencies of the power spectral densities before and after high-pass filtering are plotted (b) for protocol 1 (0.95 µm / axial scan), showing a significant bias in the mean frequency caused by filtering. (c-d) For the high-density scanning protocol (0.025 µm / axial scan), high-pass filtering causes a negligible bias in the mean frequency.

Similar articles

Cited by

References

    1. Girouard H., Iadecola C., “Neurovascular coupling in the normal brain and in hypertension, stroke, and Alzheimer disease,” J. Appl. Physiol. 100(1), 328–335 (2006).10.1152/japplphysiol.00966.2005 - DOI - PubMed
    1. Sakurada O., Kennedy C., Jehle J., Brown J. D., Carbin G. L., Sokoloff L., “Measurement of local cerebral blood flow with iodo [14C] antipyrine,” Am. J. Physiol. 234(1), H59–H66 (1978). - PubMed
    1. Calamante F., Thomas D. L., Pell G. S., Wiersma J., Turner R., “Measuring cerebral blood flow using magnetic resonance imaging techniques,” J. Cereb. Blood Flow Metab. 19(7), 701–735 (1999).10.1097/00004647-199907000-00001 - DOI - PubMed
    1. Heiss W. D., Graf R., Wienhard K., Löttgen J., Saito R., Fujita T., Rosner G., Wagner R., “Dynamic penumbra demonstrated by sequential multitracer PET after middle cerebral artery occlusion in cats,” J. Cereb. Blood Flow Metab. 14(6), 892–902 (1994).10.1038/jcbfm.1994.120 - DOI - PubMed
    1. Kleinfeld D., Mitra P. P., Helmchen F., Denk W., “Fluctuations and stimulus-induced changes in blood flow observed in individual capillaries in layers 2 through 4 of rat neocortex,” Proc. Natl. Acad. Sci. U.S.A. 95(26), 15741–15746 (1998).10.1073/pnas.95.26.15741 - DOI - PMC - PubMed

Publication types