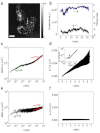
Diffusive and directional intracellular dynamics measured by field-based dynamic light scattering
- PMID: 20174115
- PMCID: PMC2839546
- DOI: 10.1364/OE.18.002858
Diffusive and directional intracellular dynamics measured by field-based dynamic light scattering
Abstract
Quantitative measurement of diffusive and directional processes of intracellular structures is not only critical in understanding cell mechanics and functions, but also has many applications, such as investigation of cellular responses to therapeutic agents. We introduce a label-free optical technique that allows non-perturbative characterization of localized intracellular dynamics. The method combines a field-based dynamic light scattering analysis with a confocal interferometric microscope to provide a statistical measure of the diffusive and directional motion of scattering structures inside a microscopic probe volume. To demonstrate the potential of this technique, we examined the localized intracellular dynamics in human epithelial ovarian cancer cells. We observed the distinctive temporal regimes of intracellular dynamics, which transitions from random to directional processes on a timescale of ~0.01 sec. In addition, we observed disrupted directional processes on the timescale of 1 approximately 5 sec by the application of a microtubule polymerization inhibitor, Colchicine, and ATP depletion.
Figures


Similar articles
-
Field-based dynamic light scattering microscopy: theory and numerical analysis.Appl Opt. 2013 Nov 1;52(31):7618-28. doi: 10.1364/AO.52.007618. Appl Opt. 2013. PMID: 24216666
-
Doppler fluctuation spectroscopy of intracellular dynamics in living tissue.J Opt Soc Am A Opt Image Sci Vis. 2019 Apr 1;36(4):665-677. doi: 10.1364/JOSAA.36.000665. J Opt Soc Am A Opt Image Sci Vis. 2019. PMID: 31044988 Free PMC article.
-
Probing chromatin condensation dynamics in live cells using interferometric scattering correlation spectroscopy.Commun Biol. 2024 Jun 24;7(1):763. doi: 10.1038/s42003-024-06457-2. Commun Biol. 2024. PMID: 38914653 Free PMC article.
-
Coherent light scattering from cellular dynamics in living tissues.Rep Prog Phys. 2024 Mar 4;87(3). doi: 10.1088/1361-6633/ad2229. Rep Prog Phys. 2024. PMID: 38433567 Review.
-
Fluorescence interferometry: principles and applications in biology.Ann N Y Acad Sci. 2008;1130:68-77. doi: 10.1196/annals.1430.038. Ann N Y Acad Sci. 2008. PMID: 18596334 Free PMC article. Review.
Cited by
-
Forward multiple scattering dominates speckle decorrelation in whole-blood flowmetry using optical coherence tomography.Biomed Opt Express. 2020 Mar 13;11(4):1947-1966. doi: 10.1364/BOE.384539. eCollection 2020 Apr 1. Biomed Opt Express. 2020. PMID: 32341859 Free PMC article.
-
Dynamic light scattering microscopy sensing mitochondria dynamics for label-free detection of triple-negative breast cancer enhanced by deep learning.Biomed Opt Express. 2023 Sep 6;14(10):5048-5059. doi: 10.1364/BOE.502083. eCollection 2023 Oct 1. Biomed Opt Express. 2023. PMID: 37854555 Free PMC article.
-
Tissue dynamics spectroscopic imaging: functional imaging of heterogeneous cancer tissue.J Biomed Opt. 2020 Sep;25(9):096006. doi: 10.1117/1.JBO.25.9.096006. J Biomed Opt. 2020. PMID: 32964703 Free PMC article.
-
Application of optical imaging and spectroscopy to radiation biology.Radiat Res. 2012 Apr;177(4):365-75. doi: 10.1667/rr2531.1. Epub 2012 Feb 23. Radiat Res. 2012. PMID: 22360397 Free PMC article. Review.
-
Biodynamic digital holography of chemoresistance in a pre-clinical trial of canine B-cell lymphoma.Biomed Opt Express. 2018 Apr 17;9(5):2214-2228. doi: 10.1364/BOE.9.002214. eCollection 2018 May 1. Biomed Opt Express. 2018. PMID: 29760982 Free PMC article.
References
Publication types
MeSH terms
Substances
Grants and funding
LinkOut - more resources
Full Text Sources

