. 2010 Feb 19;5(2):e9313.
doi: 10.1371/journal.pone.0009313.

Selective molecular alterations in the autophagy pathway in patients with Lewy body disease and in models of alpha-synucleinopathy

Affiliations

Selective molecular alterations in the autophagy pathway in patients with Lewy body disease and in models of alpha-synucleinopathy

Leslie Crews et al. PLoS One. .

Retraction in

Abstract

Background: Lewy body disease is a heterogeneous group of neurodegenerative disorders characterized by alpha-synuclein accumulation that includes dementia with Lewy bodies (DLB) and Parkinson's Disease (PD). Recent evidence suggests that impairment of lysosomal pathways (i.e. autophagy) involved in alpha-synuclein clearance might play an important role. For this reason, we sought to examine the expression levels of members of the autophagy pathway in brains of patients with DLB and Alzheimer's Disease (AD) and in alpha-synuclein transgenic mice.

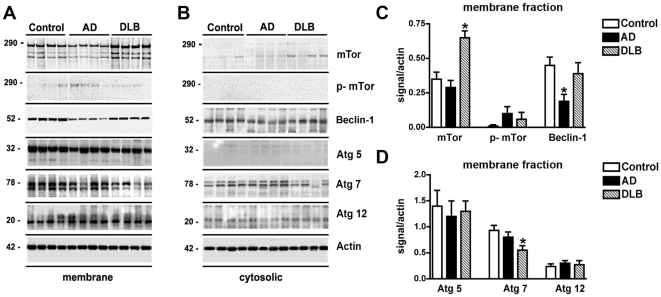
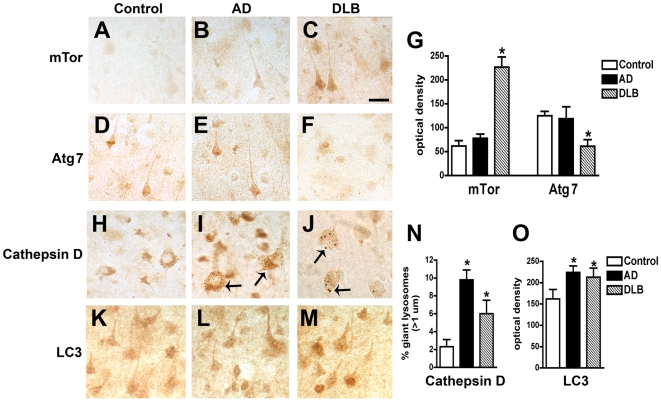
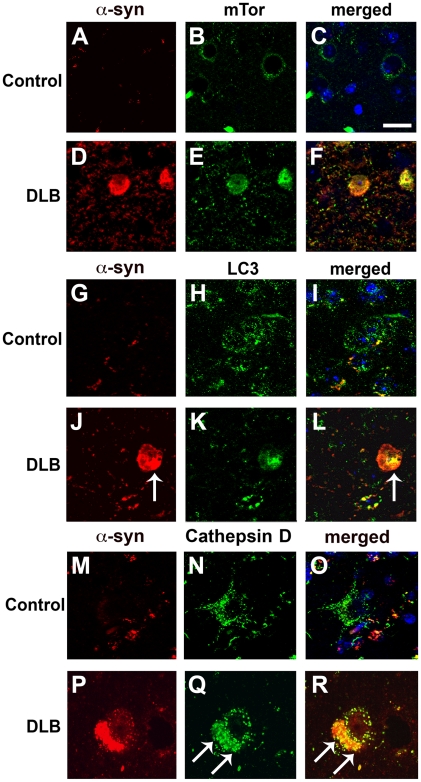
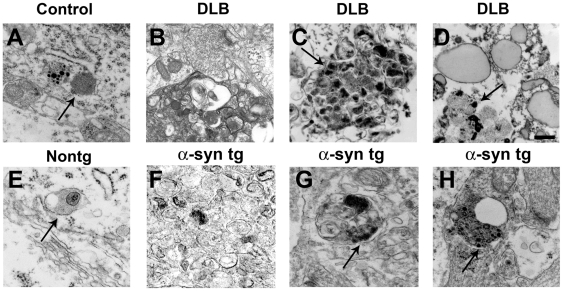
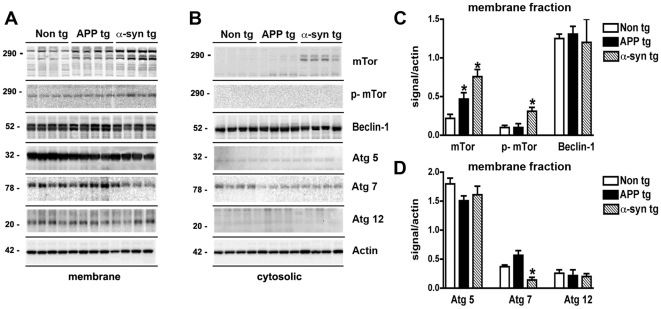
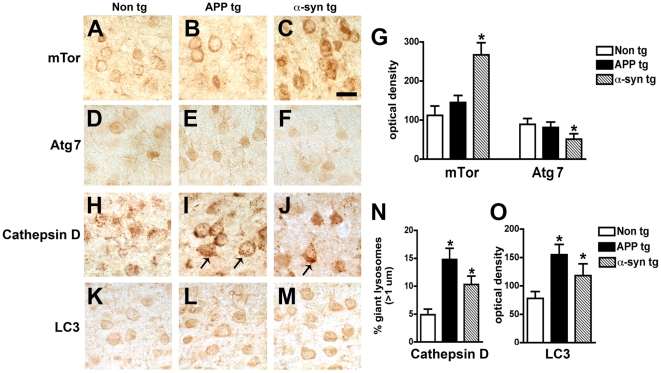
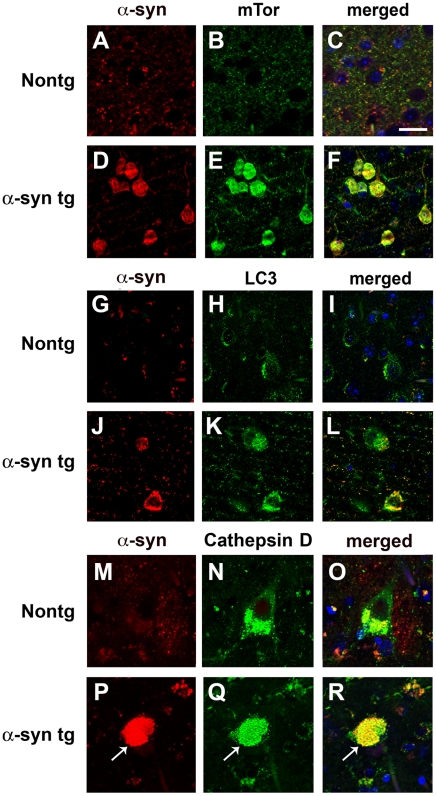
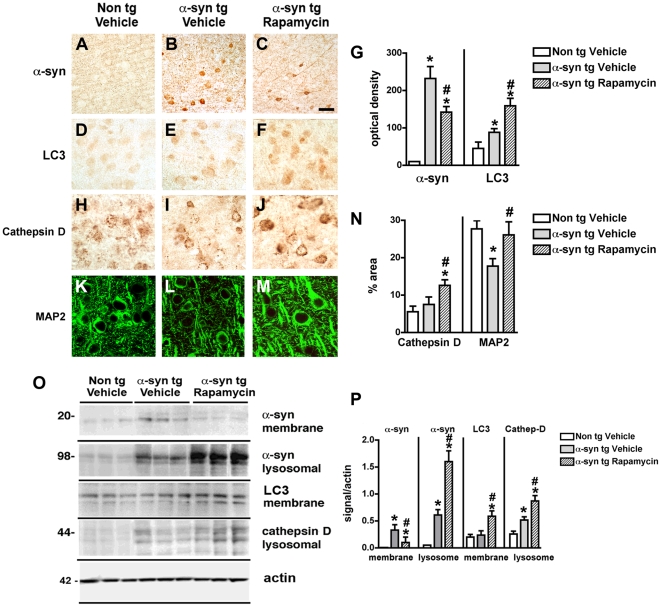
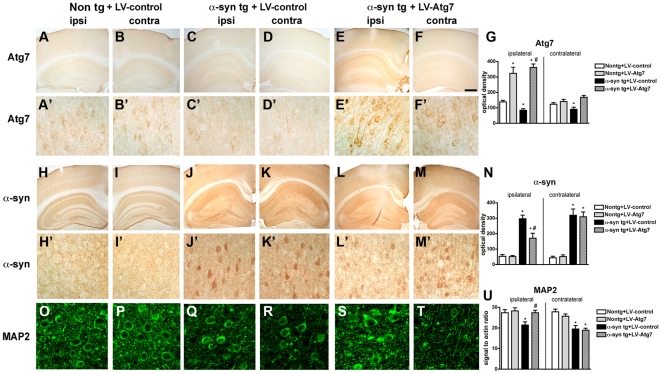
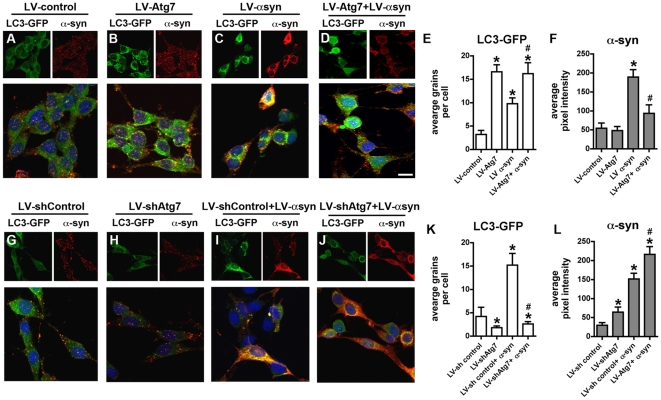
Methodology/principal findings: By immunoblot analysis, compared to controls and AD, in DLB cases levels of mTor were elevated and Atg7 were reduced. Levels of other components of the autophagy pathway such as Atg5, Atg10, Atg12 and Beclin-1 were not different in DLB compared to controls. In DLB brains, mTor was more abundant in neurons displaying alpha-synuclein accumulation. These neurons also showed abnormal expression of lysosomal markers such as LC3, and ultrastructural analysis revealed the presence of abundant and abnormal autophagosomes. Similar alterations were observed in the brains of alpha-synuclein transgenic mice. Intra-cerebral infusion of rapamycin, an inhibitor of mTor, or injection of a lentiviral vector expressing Atg7 resulted in reduced accumulation of alpha-synuclein in transgenic mice and amelioration of associated neurodegenerative alterations.

Conclusions/significance: This study supports the notion that defects in the autophagy pathway and more specifically in mTor and Atg7 are associated with neurodegeneration in DLB cases and alpha-synuclein transgenic models and supports the possibility that modulators of the autophagy pathway might have potential therapeutic effects.


Conflict of interest statement

Competing Interests: The authors have declared that no competing interests exist.

Figures

Figure 1
Figure 1. Immunoblot analysis of the autophagy pathway in the brains of AD and DLB patients.
Brain homogenates from the temporal cortex of non-demented controls, AD, and DLB patients were separated into membrane and cytosolic fractions, and 20 µg of each sample was subjected to gel electrophoresis. Immunoblots were probed with antibodies against mTor, phosphorylated (p) mTor, Beclin-1, Atg5, Atg7, Atg12 and Actin. (A) Representative immunoblots of membrane fractions. (B) Representative immunoblots of cytosolic fractions. (C) Semi-quantitative analysis of levels of mTor, p-mTor, and Beclin-1 in membrane fractions from the brains of control, AD and DLB patients. Levels of mTor were significantly increased in DLB patients. (D) Semi-quantitative analysis of levels of Atg5, Atg7, and Atg12 in membrane fractions from the brains of control, AD and DLB patients. Levels of Atg7 were significantly reduced in the brains of DLB patients. All semi-quantitative measurements were normalized to actin levels as a loading control. *p<0.05 compared to non-demented controls by one-way ANOVA with post-hoc Dunnett's test.
Figure 2
Figure 2. Immunohistochemical analysis of the autophagy pathway in the brains of AD and DLB patients.
Vibratome sections from the temporal cortex of non-demented controls, AD, and DLB patients were immunolabeled with antibodies against mTor, Atg7, Cathepsin D, and LC3, and imaged with a digital microscope. (A–C) Representative sections from control, AD and DLB brains immunolabeled with an antibody against mTor. (D–F) Representative sections from control, AD and DLB brains immunolabeled with an antibody against Atg7. (G) Semi-quantitative image analysis reveals a significant increase in mTor levels and a reduction in Atg7 levels in DLB patients compared to controls. (H–J) Representative sections from control, AD and DLB brains immunolabeled with an antibody against Cathepsin D. Pyramidal neurons in AD and DLB cases show enlarged Cathepsin D-immunoreactive lysosomes (arrows). (K–M) Representative sections from control, AD and DLB brains immunolabeled with an antibody against LC3. (N) Increased numbers of enlarged lysosomes (>1µm) in AD and DLB brains. (O) Semi-quantitative image analysis of LC3 immunoreactivity reveals increased LC3 levels in AD and DLB brains. Scale bar in panel (C) represents 20µm in all microscopy images. *p<0.05 compared to non-demented controls by one-way ANOVA with post-hoc Dunnett's test.
Figure 3
Figure 3. Double-immunolabeling analysis of autophagy markers and α-syn in the brains of patients with DLB.
Vibratome sections from the temporal cortex of non-demented controls and DLB patients were immunolabeled with antibodies against α-syn, and co-labeled with antibodies against mTor, LC3 or Cathepsin D, and imaged with a laser scanning confocal microscope. (A–D) Double-immunolabeling analysis showing increased mTor immunoreactivity in neurons of DLB patients showing α-syn accumulation. (G–L) Double-immunolabeling analysis showing increased LC3 immunoreactivity in neurons of DLB patients showing α-syn accumulation. LC3 immunoreactivity was occasionally associated with LBs (arrows). (M–R) Double-immunolabeling analysis showing enlarged Cathepsin D-immunoreactive lysosomes (arrows) in neurons of DLB patients showing α-syn accumulation. Scale bar in panel (C) represents 15µm in panels A–L and 8µm in panels M–R.
Figure 4
Figure 4. Electron microscopic analysis of abnormal autophagosomes in patients with DLB and in α-syn tg mice.
(A) Representative image from a non-demented control case showing normal neuronal lysosomes (arrow). (B–D) Abnormal autophagosomes and accumulation of electrodense deposits (arrows) in intraneuronal membrane-bound structures in the brains of patients with DLB. (E) Representative image from a non tg mouse brain showing normal neuronal lysosomes (arrow). (F–H) Abnormal autophagosome morphology and accumulation of electrodense deposits (arrows) in intraneuronal membrane-bound structures in the brains of α-syn tg mice. Scale bar in panel (C) represents 0.5µm in all panels.
Figure 5
Figure 5. Immunoblot analysis of the autophagy pathway in the brains of APP and α-syn tg mice.
Brain homogenates from non tg, APP tg, and α-syn tg mice were separated into membrane and cytosolic fractions, and 20 µg of each sample was subjected to gel electrophoresis. Immunoblots were probed with antibodies against mTor, phosphorylated (p) mTor, Beclin-1, Atg5, Atg7, Atg12 and Actin. (A) Representative immunoblots of membrane fractions. (B) Representative immunoblots of cytosolic fractions. (C) Semi-quantitative analysis of levels of mTor, p-mTor, and Beclin-1 in membrane fractions from the brains of non tg, APP tg and α-syn tg mice. Levels of mTor were significantly increased in APP tg and α-syn tg brains. (D) Semi-quantitative analysis of levels of Atg5, Atg7, and Atg12 in membrane fractions from the brains of non tg, APP tg and α-syn tg mice. Levels of Atg7 were significantly reduced in the brains of α-syn tg mice. All semi-quantitative measurements were normalized to actin levels as a loading control. *p<0.05 compared to non tg controls by one-way ANOVA with post-hoc Dunnett's test.
Figure 6
Figure 6. Immunohistochemical analysis of the autophagy pathway in the brains of APP and α-syn tg mice.
Vibratome sections from the hippocampus of non tg, APP tg and α-syn tg mice were immunolabeled with antibodies against mTor, Atg7, Cathepsin D, or LC3, and imaged with a digital microscope. All images are from the temporal cortex. (A–C) Representative sections from non tg, APP tg and α-syn tg brains immunolabeled with an antibody against mTor. (D–F) Representative sections from non tg, APP tg and α-syn tg brains immunolabeled with an antibody against Atg7. (G) Semi-quantitative image analysis reveals a significant increase in mTor levels and a reduction in Atg7 levels in α-syn tg mice compared to non tg controls. (H–J) Representative sections from non tg, APP tg and α-syn tg brains immunolabeled with an antibody against Cathepsin D. Enlarged Cathepsin D-immunoreactive lysosomes (arrows) were detected in APP tg and α-syn tg mice. (K–M) Representative sections from non tg, APP tg and α-syn tg brains immunolabeled with an antibody against LC3. (N) Increased numbers of enlarged lysosomes (>1µm) in APP tg and α-syn tg mouse brains. (O) Semi-quantitative image analysis of LC3 immunoreactivity reveals increased LC3 levels in APP tg and α-syn tg brains. Scale bar in panel (C) represents 10µm in all microscopy images. *p<0.05 compared to non tg controls by one-way ANOVA with post-hoc Dunnett's test.
Figure 7
Figure 7. Double-immunolabeling analysis of autophagy and α-syn in the brains of α-syn tg mice.
Vibratome sections from the brains of non tg and α-syn tg mice were immunolabeled with antibodies against α-syn, and co-labeled with antibodies against mTor, LC3 or Cathepsin D, and imaged with a laser scanning confocal microscope. All images are from the temporal cortex. (A–D) Double-immunolabeling analysis showing increased mTor immunoreactivity in α-syn-positive neurons in α-syn tg mice. (G–L) Double-immunolabeling analysis showing increased LC3 immunoreactivity in neurons of α-syn tg mice showing α-syn accumulation. (M–R) Double-immunolabeling analysis showing enlarged Cathepsin D-immunoreactive lysosomes (arrows) in neurons of α-syn tg mice showing α-syn accumulation. Scale bar in panel (C) represents 20µm in panels A–L and 10µm in panels M–R.
Figure 8
Figure 8. Immunohistochemical and immunoblot analysis of the effects of rapamycin treatment in α-syn tg mice.
For panels A–M, vibratome sections from the hippocampus of non tg and α-syn tg mice were immunolabeled with antibodies against α-syn, LC3, Cathepsin D or MAP2 and imaged with a digital microscope. All images are from the temporal cortex. For panel O, brain homogenates from non tg and α-syn tg mice were separated into membrane and lysosomal fractions, and 20 µg of each sample was subjected to gel electrophoresis. (A–C) Representative sections from the brains of vehicle-treated non tg mice and vehicle- and Rapamycin-treated α-syn tg mice immunolabeled with an antibody against α-syn. (D–F) Representative sections from the brains of vehicle-treated non tg mice and vehicle- and Rapamycin-treated α-syn tg mice immunolabeled with an antibody against LC3. (G) Semi-quantitative image analysis showing reduced α-syn immunoreactivity and increased LC3 immunoreactivity in the hippocampus of α-syn tg mice treated with Rapamycin. (H–J) Representative sections from the brains of vehicle-treated non tg mice and vehicle- and Rapamycin-treated α-syn tg mice immunolabeled with an antibody against Cathepsin D. (K–M) Representative sections from the brains of vehicle-treated non tg mice and vehicle- and Rapamycin-treated α-syn tg mice immunolabeled with an antibody against MAP2. (N) Semi-quantitative image analysis showing increased Cathepsin D immunoreactivity in the hippocampus of α-syn tg mice treated with Rapamycin. Reduced levels of MAP2 in the hippocampus of vehicle-treated α-syn tg mice is rescued by Rapamycin treatment. (O) Representative immunoblot analysis of membrane and lysosomal fractions probed with antibodies against α-syn, LC3, and Cathepsin D. (P) Semi-quantitative image analysis of immunoblots showing redistribution of α-syn from membrane to lysosomal fractions and an associated increase in LC3 and Cathepsin D levels. All semi-quantitative measurements were normalized to actin levels as a loading control. Scale bar in panel (C) represents 40µm in panels A–C, 20µm in panels D–E and H–J, and 10µm in panels K–M. *p<0.05 compared to vehicle-treated non tg controls by one-way ANOVA with post-hoc Dunnett's test. #p<0.05 compared to vehicle-treated α-syn tg mice by one-way ANOVA with post-hoc Tukey-Kramer test.
Figure 9
Figure 9. Immunohistochemical analysis of the effects of LV-Atg7 treatment in α-syn tg mice.
For panels A–M, vibratome sections from non tg and α-syn tg mice that received LV injections into the cortex and hippocampus were immunolabeled with antibodies against Atg7 or α-syn and imaged with a digital microscope. Panels A′–M′ represent higher-power images from the hippocampus of the corresponding low-power panels in panels A–M. For panels O–T, effects of rapamycin treatment on α-syn accumulation, autophagy and neuronal integrity in the brains of α-syn tg mice. For panels A–M, vibratome sections from the hippocampus of non tg and α-syn tg mice were immunolabeled with an antibody against MAP2 and imaged with a laser scanning confocal microscope, and images were obtained from the temporal cortex. (A–F) Representative sections from the brains of non tg (A, B) and α-syn tg mice (C–F) that received injections with LV-control (A–D) or LV-Atg7 (E, F) and were immunolabeled with an antibody against Atg7. Images show sections from the hemisphere ipsilateral (ipsi) or contralateral (contra) to the sites of injection. (G) Semi-quantitative image analysis of Atg7 immunoreactivity in non tg and α-syn tg mice show increased Atg7 levels ipsilateral to the injection sites in the brains of animals that received LV-Atg7. (H–M) Representative sections from the brains of non tg (H, I) and α-syn tg mice (J–M) that received injections with LV-control (H–K) or LV-Atg7 (L, M) and were immunolabeled with an antibody against α-syn. Images show sections from the hemisphere ipsilateral (ipsi) or contralateral (contra) to the sites of injection. (N) Semi-quantitative image analysis of α-syn immunoreactivity in non tg and α-syn tg mice show reduced α-syn levels ipsilateral to the injection sites in the brains of α-syn tg mice that received LV-Atg7 injections. (O–T) Representative sections from the brains of non tg (O, P) and α-syn tg mice (Q–T) that received injections with LV-control (O–R) or LV-Atg7 (S, T) and were immunolabeled with an antibody against MAP2. Images show sections from the hemisphere ipsilateral (ipsi) or contralateral (contra) to the sites of injection. (U) Semi-quantitative image analysis of MAP2 immunoreactivity in non tg and α-syn tg mice shows a recovery of MAP2 levels ipsilateral to the injection sites in the brains of α-syn tg mice that received LV-Atg7 injections. Scale bar in panel (F) represents 0.1mm in panels A–F and H–M, 20µm in panels A′–F′ and H′–M′, and 10µm in panels O–T. *p<0.05 compared to LV-control-treated non tg controls by one-way ANOVA with post-hoc Dunnett's test. #p<0.05 compared to LV-control-treated α-syn tg mice by one-way ANOVA with post-hoc Tukey-Kramer test.
Figure 10
Figure 10. Immunocytochemical analysis of the effects of Atg7 over-expression or knockdown in a neuronal cell model.
For Atg7 overexpression, B103 neuronal cells on coverslips and infected with a lentivirus expressing LC3-GFP in combination with empty LV-control, LV-Atg7, or LV-α-syn. For Atg7 knockdown, B103 neuronal cells on coverslips were infected with a lentivirus expressing LC3-GFP in combination with empty LV-shControl, LV-shAtg, or LV-αsyn. Cells were fixed and immunolabled with an antibody against α-syn and imaged with a laser scanning confocal microscope. In each set of 3 panels, the upper left panel depicts GFP fluorescence, the upper right panel depicts α-syn immunolabeling, and the lower panel depicts the merged image. (A–D) Representative images showing GFP fluorescence (marker of LC3 localization) and α-syn immunoreactivity in B103 cells infected with LV-control (A), LV-Atg7 (B), LV-αsyn (C) or LV-Atg7+LV-αsyn (D). (E) Semi-quantitative analysis of LC3-GFP positive punctae shows an increase in LC3 in cultures infected with LV-Atg7 or LV-α-syn alone or in combination. (F) Semi-quantitative analysis of α-syn immunoreactivity reveals a reduction in α-syn levels in cultures co-infected with LV-Atg7 and LV-αsyn. (G–J) Representative images showing GFP fluorescence (marker of LC3 localization) and α-syn immunoreactivity in B103 cells infected with LV-shControl (G), LV-shAtg7 (H), LV-αsyn (I) or LV-shAtg7+LV-αsyn (J). (K) Semi-quantitative analysis of LC3-GFP positive punctae shows a reduction in LC3 in cultures infected with LV-shAtg7 alone or in combination with LV-αsyn. (L) Semi-quantitative analysis of α-syn immunoreactivity reveals an increase in α-syn levels in cultures co-infected with LV-shAtg7 and LV-αsyn. Scale bar in large panel in (D) represents 15µm in all small panels and 10µm in all large panels. *p<0.05 compared to LV-control-treated cultures by one-way ANOVA with post-hoc Dunnett's test. #p<0.05 compared to LV-αsyn-treated cultures by one-way ANOVA with post-hoc Tukey-Kramer test.

Similar articles

Cited by

References

    1. Dauer W, Kholodilov N, Vila M, Trillat AC, Goodchild R, et al. Resistance of alpha -synuclein null mice to the parkinsonian neurotoxin MPTP. Proc Natl Acad Sci U S A. 2002;99:14524–14529. - PMC - PubMed
    1. Dauer W, Przedborski S. Parkinson's disease: mechanisms and models. Neuron. 2003;39:889–909. - PubMed
    1. Walsh DM, Selkoe DJ. Oligomers on the brain: the emerging role of soluble protein aggregates in neurodegeneration. Protein Pept Lett. 2004;11:213–228. - PubMed
    1. Klein WL, Krafft GA, Finch CE. Targeting small Abeta oligomers: the solution to an Alzheimer's disease conundrum? Trends Neurosci. 2001;24:219–224. - PubMed
    1. Hashimoto M, Rockenstein E, Crews L, Masliah E. Role of protein aggregation in mitochondrial dysfunction and neurodegeneration in Alzheimer's and Parkinson's diseases. Neuromolecular Med. 2003;4:21–36. - PubMed

Publication types

MeSH terms