

Numerical modelling of the V-J combinations of the T cell receptor TRA/TRD locus
- PMID: 20174554
- PMCID: PMC2824756
- DOI: 10.1371/journal.pcbi.1000682
Numerical modelling of the V-J combinations of the T cell receptor TRA/TRD locus
Abstract
T-Cell antigen Receptor (TR) repertoire is generated through rearrangements of V and J genes encoding alpha and beta chains. The quantification and frequency for every V-J combination during ontogeny and development of the immune system remain to be precisely established. We have addressed this issue by building a model able to account for Valpha-Jalpha gene rearrangements during thymus development of mice. So we developed a numerical model on the whole TRA/TRD locus, based on experimental data, to estimate how Valpha and Jalpha genes become accessible to rearrangements. The progressive opening of the locus to V-J gene recombinations is modeled through windows of accessibility of different sizes and with different speeds of progression. Furthermore, the possibility of successive secondary V-J rearrangements was included in the modelling. The model points out some unbalanced V-J associations resulting from a preferential access to gene rearrangements and from a non-uniform partition of the accessibility of the J genes, depending on their location in the locus. The model shows that 3 to 4 successive rearrangements are sufficient to explain the use of all the V and J genes of the locus. Finally, the model provides information on both the kinetics of rearrangements and frequencies of each V-J associations. The model accounts for the essential features of the observed rearrangements on the TRA/TRD locus and may provide a reference for the repertoire of the V-J combinatorial diversity.
Conflict of interest statement
This work was supported by institutional grants from the Institut National de la Santé et de la Recherche Médicale (INSERM), from the Centre National de la Recherche Scientifique (CNRS), and from a specific grant “Thématiques Prioritaires de la Région Rhône-Alpes”. M-AS was recipient of a PhD fellowship from Cluster 10 of the Région Rhône-Alpes; NP was recipient of a fellowship from the INSERM and CEA. FT was recipient of a fellowship from the ANRT (Agence Nationale de la Recherche et de la Technologie) and JD has been supported by the EC Alfa project IPECA. The authors have no conflicting financial interest.
Figures


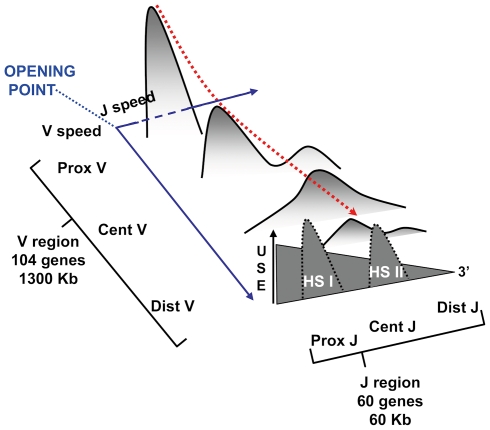
 The fixed parameters of the simulation were as follow, one million of alpha chains, ongoing 1 to 4 rearrangements with opening speeds of 18 Kb/h and 1.03 Kb/h for the V and the J region respectively; (B) J region utilization: the X axis represents the J region in Kb; (C) and (D) Amplitude of J region utilization by opposite V genes, V1 (distal) and V21 (proximal). The X axis represents experimental quantification on 9 J genes. The Y axis shows the experimental utilization frequency of 9 J genes by the V1 and V21 genes. (E) and (F) Amplitude of J region utilization in the model. The X axis represents the J genes. The Y axis shows the model frequency utilization by each J genes. (G) and (H) Superposition of experimental and simulated data for the 9 J genes. The X axis represents experimental quantification on 9 J genes. V and J regions utilization from simulated data are similar to experimental data obtained from .


Similar articles
-
Genomic and expression analyses of Tursiops truncatus T cell receptor gamma (TRG) and alpha/delta (TRA/TRD) loci reveal a similar basic public γδ repertoire in dolphin and human.BMC Genomics. 2016 Aug 15;17(1):634. doi: 10.1186/s12864-016-2841-9. BMC Genomics. 2016. PMID: 27528257 Free PMC article.
-
IMGT/GeneInfo: T cell receptor gamma TRG and delta TRD genes in database give access to all TR potential V(D)J recombinations.BMC Bioinformatics. 2006 Apr 26;7:224. doi: 10.1186/1471-2105-7-224. BMC Bioinformatics. 2006. PMID: 16640788 Free PMC article.
-
Quantitative and qualitative changes in V-J alpha rearrangements during mouse thymocytes differentiation: implication for a limited T cell receptor alpha chain repertoire.J Exp Med. 2002 Nov 4;196(9):1163-73. doi: 10.1084/jem.20021074. J Exp Med. 2002. PMID: 12417627 Free PMC article.
-
Dynamic aspects of TCRalpha gene recombination: qualitative and quantitative assessments of the TCRalpha chain repertoire in man and mouse.Adv Exp Med Biol. 2009;650:82-92. doi: 10.1007/978-1-4419-0296-2_7. Adv Exp Med Biol. 2009. PMID: 19731803 Review.
-
Enforcing order within a complex locus: current perspectives on the control of V(D)J recombination at the murine T-cell receptor alpha/delta locus.Immunol Rev. 2004 Aug;200:224-32. doi: 10.1111/j.0105-2896.2004.00155.x. Immunol Rev. 2004. PMID: 15242408 Review.
Cited by
-
A Novel Mathematical Model That Predicts the Protection Time of SARS-CoV-2 Antibodies.Viruses. 2023 Feb 20;15(2):586. doi: 10.3390/v15020586. Viruses. 2023. PMID: 36851801 Free PMC article.
-
On the organization of human T-cell receptor loci: log-periodic distribution of T-cell receptor gene segments.J R Soc Interface. 2016 Jan;13(114):20150911. doi: 10.1098/rsif.2015.0911. J R Soc Interface. 2016. PMID: 26763333 Free PMC article. Review.
-
A mathematical model simulating the adaptive immune response in various vaccines and vaccination strategies.Sci Rep. 2024 Oct 14;14(1):23995. doi: 10.1038/s41598-024-74221-x. Sci Rep. 2024. PMID: 39402093 Free PMC article.
-
Chromatin architecture, CCCTC-binding factor, and V(D)J recombination: managing long-distance relationships at antigen receptor loci.J Immunol. 2013 May 15;190(10):4915-21. doi: 10.4049/jimmunol.1300218. J Immunol. 2013. PMID: 23645930 Free PMC article. Review.
-
Epigenetic aspects of lymphocyte antigen receptor gene rearrangement or 'when stochasticity completes randomness'.Immunology. 2013 Jun;139(2):141-50. doi: 10.1111/imm.12057. Immunology. 2013. PMID: 23278765 Free PMC article. Review.
References
-
- Cobb RM, Oestreich KJ, Osipovich OA, Oltz EM. Accessibility control of V(D)J recombination. Adv Immunol. 2006;91:45–109. - PubMed
-
- Jouvin-Marche E, Aude-Garcia C, Candeias S, Borel E, Hachemi-Rachedi S, et al. Differential chronology of TCRADV2 gene use by alpha and delta chains of the mouse TCR. Eur J Immunol. 1998;28:818–827. - PubMed
-
- Rytkonen M, Hurwitz JL, Tolonen K, Pelkonen J. Evidence for recombinatorial hot spots at the T cell receptor J alpha locus. Eur J Immunol. 1994;24:107–115. - PubMed
-
- Villey I, Caillol D, Selz F, Ferrier P, de Villartay JP. Defect in rearrangement of the most 5′ TCR-J alpha following targeted deletion of T early alpha (TEA): implications for TCR alpha locus accessibility. Immunity. 1996;5:331–342. - PubMed
Publication types
MeSH terms
Substances
LinkOut - more resources
Full Text Sources
