

Inhibitor of DNA binding 3 limits development of murine slam-associated adaptor protein-dependent "innate" gammadelta T cells
- PMID: 20174563
- PMCID: PMC2824806
- DOI: 10.1371/journal.pone.0009303
Inhibitor of DNA binding 3 limits development of murine slam-associated adaptor protein-dependent "innate" gammadelta T cells
Abstract
Background: Id3 is a dominant antagonist of E protein transcription factor activity that is induced by signals emanating from the alphabeta and gammadelta T cell receptor (TCR). Mice lacking Id3 were previously shown to have subtle defects in positive and negative selection of TCRalphabeta+ T lymphocytes. More recently, Id3(-/-) mice on a C57BL/6 background were shown to have a dramatic expansion of gammadelta T cells.
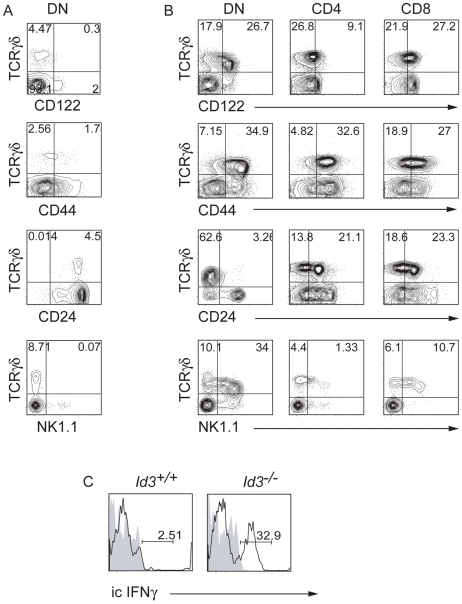
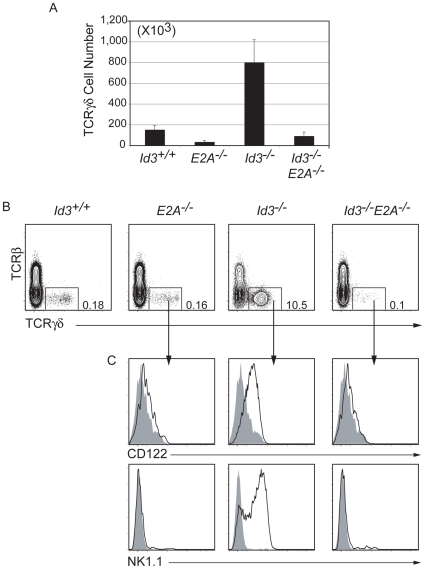
Methodology/principal findings: Here we report that mice lacking Id3 have reduced thymocyte numbers but increased production of gammadelta T cells that express a Vgamma1.1+Vdelta6.3+ receptor with restricted junctional diversity. These Vgamma1.1+Vdelta6.3+ T cells have multiple characteristics associated with "innate" lymphocytes such as natural killer T (NKT) cells including an activated phenotype, expression of the transcription factor PLZF, and rapid production of IFNg and interleukin-4. Moreover, like other "innate" lymphocyte populations, development of Id3(-/-) Vgamma1.1+Vdelta6.3+ T cells requires the signaling adapter protein SAP.
Conclusions: Our data provide novel insight into the requirements for development of Vgamma1.1+Vdelta6.3+ T cells and indicate a role for Id3 in repressing the response of "innate" gammadelta T cells to SAP-mediated expansion or survival.
Conflict of interest statement
Figures


Similar articles
-
αβ versus γδ fate choice: counting the T-cell lineages at the branch point.Immunol Rev. 2010 Nov;238(1):169-81. doi: 10.1111/j.1600-065X.2010.00947.x. Immunol Rev. 2010. PMID: 20969592 Free PMC article. Review.
-
Id3 and Id2 act as a dual safety mechanism in regulating the development and population size of innate-like γδ T cells.J Immunol. 2014 Feb 1;192(3):1055-1063. doi: 10.4049/jimmunol.1302694. Epub 2013 Dec 30. J Immunol. 2014. PMID: 24379125 Free PMC article.
-
TCR-inducible PLZF transcription factor required for innate phenotype of a subset of gammadelta T cells with restricted TCR diversity.Proc Natl Acad Sci U S A. 2009 Jul 28;106(30):12453-8. doi: 10.1073/pnas.0903895106. Epub 2009 Jul 15. Proc Natl Acad Sci U S A. 2009. PMID: 19617548 Free PMC article.
-
Dok-1 overexpression promotes development of γδ natural killer T cells.Eur J Immunol. 2012 Sep;42(9):2491-504. doi: 10.1002/eji.201242421. Epub 2012 Jul 16. Eur J Immunol. 2012. PMID: 22736313
-
The Role of Adaptor Proteins in the Biology of Natural Killer T (NKT) Cells.Front Immunol. 2019 Jun 25;10:1449. doi: 10.3389/fimmu.2019.01449. eCollection 2019. Front Immunol. 2019. PMID: 31293596 Free PMC article. Review.
Cited by
-
Id2 Collaborates with Id3 To Suppress Invariant NKT and Innate-like Tumors.J Immunol. 2017 Apr 15;198(8):3136-3148. doi: 10.4049/jimmunol.1601935. Epub 2017 Mar 3. J Immunol. 2017. PMID: 28258199 Free PMC article.
-
SAP protein-dependent natural killer T-like cells regulate the development of CD8(+) T cells with innate lymphocyte characteristics.Immunity. 2010 Aug 27;33(2):203-15. doi: 10.1016/j.immuni.2010.07.013. Epub 2010 Jul 30. Immunity. 2010. PMID: 20674402 Free PMC article.
-
Disorderly conduct in gammadelta versus alphabeta T cell lineage commitment.Semin Immunol. 2010 Aug;22(4):222-7. doi: 10.1016/j.smim.2010.04.003. Epub 2010 May 6. Semin Immunol. 2010. PMID: 20451409 Free PMC article. Review.
-
Transcriptional regulation of the NKT cell lineage.Curr Opin Immunol. 2013 Apr;25(2):161-7. doi: 10.1016/j.coi.2013.01.003. Epub 2013 Feb 9. Curr Opin Immunol. 2013. PMID: 23402834 Free PMC article. Review.
-
αβ versus γδ fate choice: counting the T-cell lineages at the branch point.Immunol Rev. 2010 Nov;238(1):169-81. doi: 10.1111/j.1600-065X.2010.00947.x. Immunol Rev. 2010. PMID: 20969592 Free PMC article. Review.
References
-
- Starr TK, Jameson SC, Hogquist KA. Positive and negative selection of T cells. Annu Rev Immunol. 2003;21:139–176. - PubMed
-
- Taghon T, Rothenberg EV. Molecular mechanisms that control mouse and human TCR-alphabeta and TCR-gammadelta T cell development. Semin Immunopathol. 2008;30:383–398. - PubMed
-
- Bhandoola A, von Boehmer H, Petrie HT, Zuniga-Pflucker JC. Commitment and developmental potential of extrathymic and intrathymic T cell precursors: plenty to choose from. Immunity. 2007;26:678–689. - PubMed
-
- Capone M, Curnow J, Bouvier G, Ferrier P, Horvat B. T cell development in TCR-alpha beta transgenic mice. Analysis using V(D)J recombination substrates. J Immunol. 1995;154:5165–5172. - PubMed
Publication types
MeSH terms
Substances
Grants and funding
LinkOut - more resources
Full Text Sources
Miscellaneous
