A role for S1P and S1P1 in immature-B cell egress from mouse bone marrow
- PMID: 20174580
- PMCID: PMC2823786
- DOI: 10.1371/journal.pone.0009277
A role for S1P and S1P1 in immature-B cell egress from mouse bone marrow
Erratum in
- PLoS One. 2010;5(3). doi: 10.1371/annotation/2ae645ec-9413-4f7d-b51f-eb0678fa2f1b
Abstract
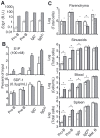
B lymphocyte egress from secondary lymphoid organs requires sphingosine-1-phosphate (S1P) and S1P receptor-1 (S1P1). However, whether S1P contributes to immature-B cell egress from the bone marrow (BM) has not been fully assessed. Here we report that in S1P- and S1P1-conditionally deficient mice, the number of immature-B cells in the BM parenchyma increased, while it decreased in the blood. Moreover, a slower rate of bromodeoxyuridine incorporation suggested immature-B cells spent longer in the BM of mice in which S1P1-S1P signaling was genetically or pharmacologically impaired. Transgenic expression of S1P1 in developing B cells was sufficient to mobilize pro- and pre-B cells from the BM. We conclude that the S1P1-S1P pathway contributes to egress of immature-B cells from BM, and that this mechanism is partially redundant with other undefined pathways.
Conflict of interest statement
Figures


Similar articles
-
Sphingosine 1-phosphate receptor type 1 regulates egress of mature T cells from mouse bone marrow.Int Immunol. 2010 Jun;22(6):515-25. doi: 10.1093/intimm/dxq036. Epub 2010 May 23. Int Immunol. 2010. PMID: 20497959
-
[Effects of sphingosine 1-phosphate on functions of T cell - review].Zhongguo Shi Yan Xue Ye Xue Za Zhi. 2005 Aug;13(4):718-22. Zhongguo Shi Yan Xue Ye Xue Za Zhi. 2005. PMID: 16129068 Chinese.
-
The S1P-analog FTY720 differentially modulates T-cell homing via HEV: T-cell-expressed S1P1 amplifies integrin activation in peripheral lymph nodes but not in Peyer patches.Blood. 2005 Aug 15;106(4):1314-22. doi: 10.1182/blood-2004-09-3687. Epub 2005 May 3. Blood. 2005. PMID: 15870184 Free PMC article.
-
FTY720 (fingolimod) in Multiple Sclerosis: therapeutic effects in the immune and the central nervous system.Br J Pharmacol. 2009 Nov;158(5):1173-82. doi: 10.1111/j.1476-5381.2009.00451.x. Epub 2009 Oct 8. Br J Pharmacol. 2009. PMID: 19814729 Free PMC article. Review.
-
Sphingosine-1-phosphate and lymphocyte egress from lymphoid organs.Annu Rev Immunol. 2012;30:69-94. doi: 10.1146/annurev-immunol-020711-075011. Epub 2011 Dec 5. Annu Rev Immunol. 2012. PMID: 22149932 Review.
Cited by
-
Chronic alcohol consumption impairs distribution and compromises circulation of B cells in B16BL6 melanoma-bearing mice.J Immunol. 2012 Aug 1;189(3):1340-8. doi: 10.4049/jimmunol.1200442. Epub 2012 Jun 29. J Immunol. 2012. PMID: 22753935 Free PMC article.
-
B cell homeostasis and plasma cell homing controlled by Krüppel-like factor 2.Proc Natl Acad Sci U S A. 2011 Jan 11;108(2):710-5. doi: 10.1073/pnas.1012858108. Epub 2010 Dec 27. Proc Natl Acad Sci U S A. 2011. PMID: 21187409 Free PMC article.
-
Sphingosine-1-Phosphate Signaling in Immune Cells and Inflammation: Roles and Therapeutic Potential.Mediators Inflamm. 2016;2016:8606878. doi: 10.1155/2016/8606878. Epub 2016 Feb 7. Mediators Inflamm. 2016. PMID: 26966342 Free PMC article. Review.
-
Epstein-Barr Virus Induced Gene-2 Upregulation Identifies a Particular Subtype of Chronic Fatigue Syndrome/Myalgic Encephalomyelitis.Front Pediatr. 2019 Mar 13;7:59. doi: 10.3389/fped.2019.00059. eCollection 2019. Front Pediatr. 2019. PMID: 30918887 Free PMC article. Review.
-
Sphingosine-1-phosphate lyase deficiency produces a pro-inflammatory response while impairing neutrophil trafficking.J Biol Chem. 2011 Mar 4;286(9):7348-58. doi: 10.1074/jbc.M110.171819. Epub 2010 Dec 20. J Biol Chem. 2011. PMID: 21173151 Free PMC article.
References
-
- Osmond DG, Batten SJ. Genesis of B lymphocytes in the bone marrow: extravascular and intravascular localization of surface IgM-bearing cells in mouse bone marrow detected by electron-microscope radioautography after in vivo perfusion of 125I anti-IgM antibody. Am J Anat. 1984;170:349–365. - PubMed
-
- Batten SJ, Osmond DG. The localization of B lymphocytes in mouse bone marrow: radioautographic studies after in vivo perfusion of radiolabelled anti-IgM antibody. J Immunol Methods. 1984;72:381–399. - PubMed
-
- Pappu R, Schwab SR, Cornelissen I, Pereira JP, Regard JB, et al. Promotion of lymphocyte egress into blood and lymph by distinct sources of sphingosine-1-phosphate. Science. 2007;316:295–298. - PubMed
-
- Schwab SR, Pereira JP, Matloubian M, Xu Y, Huang Y, et al. Lymphocyte sequestration through S1P lyase inhibition and disruption of S1P gradients. Science. 2005;309:1735–1739. - PubMed
Publication types
MeSH terms
Substances
Grants and funding
LinkOut - more resources
Full Text Sources
Molecular Biology Databases

