

Auto-FACE: an NMR based binding site mapping program for fast chemical exchange protein-ligand systems
- PMID: 20174626
- PMCID: PMC2823773
- DOI: 10.1371/journal.pone.0008943
Auto-FACE: an NMR based binding site mapping program for fast chemical exchange protein-ligand systems
Abstract
Background: Nuclear Magnetic Resonance (NMR) spectroscopy offers a variety of experiments to study protein-ligand interactions at atomic resolution. Among these experiments, 15N Heteronuclear Single Quantum Correlation (HSQC)experiment is simple, less time consuming and highly informative in mapping the binding site of the ligand. The interpretation of 15N HSQC becomes ambiguous when the chemical shift perturbations are caused by non-specific interactions like allosteric changes and local structural rearrangement. Under such cases, detailed chemical exchange analysis based on chemical shift perturbation will assist in locating the binding site accurately.
Methodology/principal findings: We have automated the mapping of binding sites for fast chemical exchange systems using information obtained from 15N HSQC spectra of protein serially titrated with ligand of increasing concentrations. The automated program Auto-FACE (Auto-FAst Chemical Exchange analyzer) determines the parameters, e.g. rate of change of perturbation, binding equilibrium constant and magnitude of chemical shift perturbation to map the binding site residues.Interestingly, the rate of change of perturbation at lower ligand concentration is highly sensitive in differentiating the binding site residues from the non-binding site residues. To validate this program, the interaction between the protein hBcl(XL) and the ligand BH3I-1 was studied. Residues in the hydrophobic BH3 binding groove of hBcl(XL) were easily identified to be crucial for interaction with BH3I-1 from other residues that also exhibited perturbation. The geometrically averaged equilibrium constant (3.0 x 10(4)) calculated for the residues present at the identified binding site is consistent with the values obtained by other techniques like isothermal calorimetry and fluorescence polarization assays (12.8 x 10(4)). Adjacent to the primary site, an additional binding site was identified which had an affinity of 3.8 times weaker than the former one. Further NMR based model fitting for individual residues suggest single site model for residues present at these binding sites and two site model for residues present between these sites. This implies that chemical shift perturbation can represent the local binding event much more accurately than the global binding event.
Conclusion/significance: Detail NMR chemical shift perturbation analysis enabled binding site residues to be distinguished from non-binding site residues for accurate mapping of interaction site in complex fast exchange system between small molecule and protein. The methodology is automated and implemented in a program called "Auto-FACE", which also allowed quantitative information of each interaction site and elucidation of binding mechanism.
Conflict of interest statement
Figures
 and
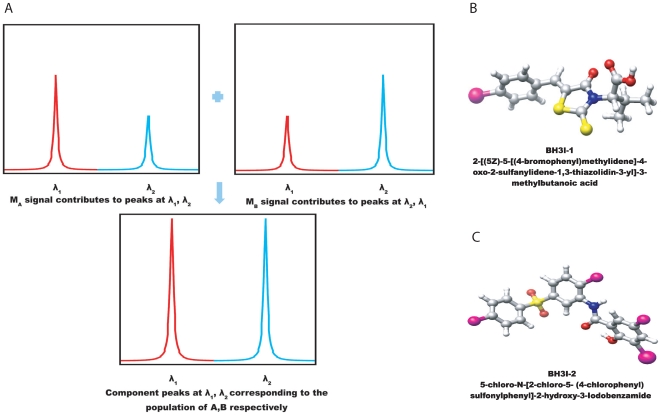
and  both contributes to the component peaks at
  and
and  which are directly correlated with its respective population
  and
and  . (B) & (C) Structural comparison of BH3I-1 and its analogue BH3I-2.
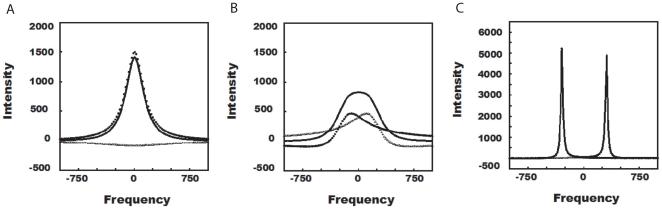
 ) are set at
  300Hz for site A and B. The
  relaxation rates are 1Hz each. Assuming forward and reverse rates to be same, the chemical exchange rates are set at 2400 sec
 , 1200 sec
 and 100 sec
 , for fast, intermediate and slow exchange systems, respectively. In all cases, the population of A∶B is fixed at 1∶1. (
 : Component of site A, ▪▪▪: Component of site B, – : Sum of both components (A+B)).
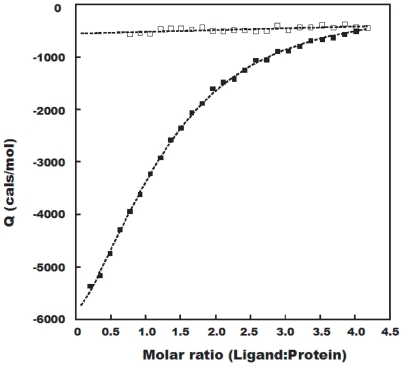
 ) : Blank experiment where 1 mM of BH3I-1 was titrated into 20 mM phosphate buffer. (▪) : 1mM of BH3I-1 was titrated into 25
  M
M  . In all buffer solutions, concentration of DMSO was adjusted to 2.5%.
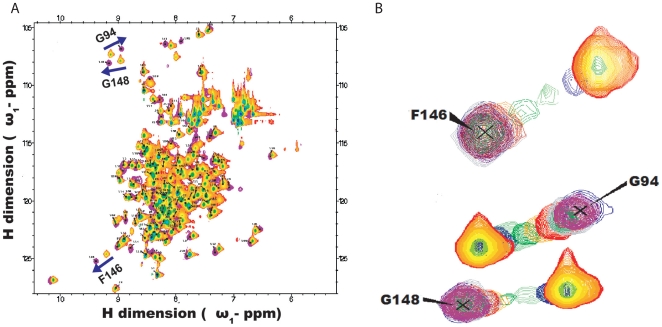
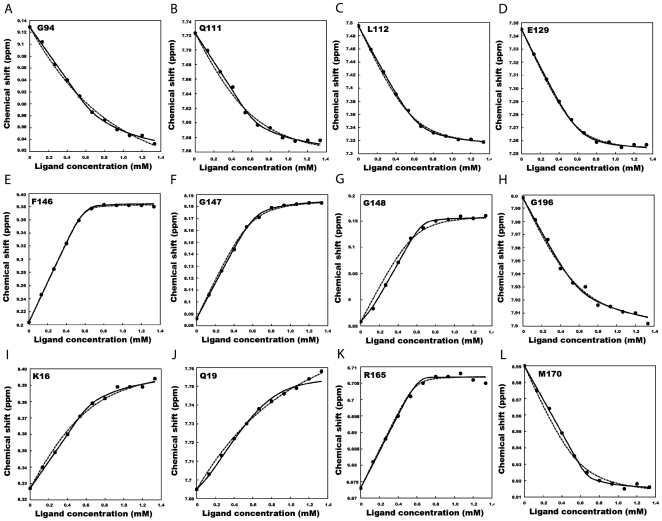
 : Experimental data,


 : Single site model, – : Two site sequential model.
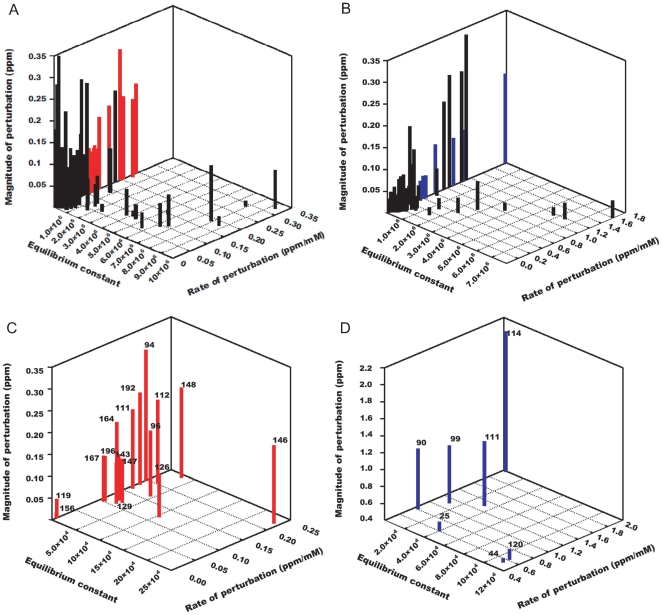
 and
and  resonances, with no threshold set for slope and magnitude of perturbation. (C) and (D) are plots for
  and
and  resonances, with threshold set at
  which corresponds to 0.01 and 0.5 ppm/mM for slope values of
  and
and  residues and to
  and
and  ppm for magnitude of perturbation of
  and
and  residues. For both plots, equilibrium constants falling within 0.15 to 0.7 percentile were used.
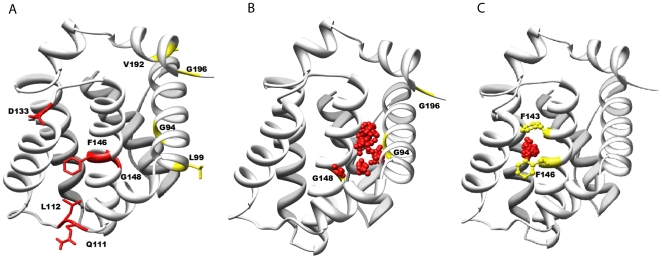
 ppm. Other parameters like
  (standard deviation for data spread),
  (number of random points to fill the sphere) and
  (an offset in
  added to radius of sphere) were set at 3, 2000 and 1, respectively. All the figures were made using the software Chimera .
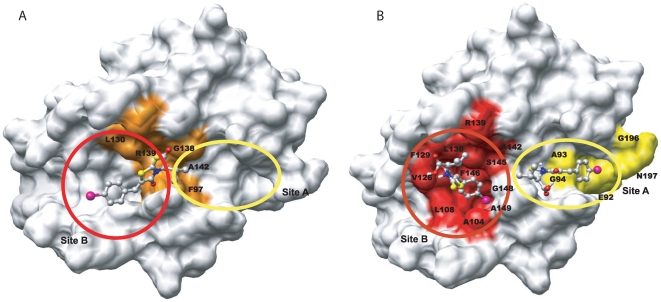
 , respectively. In the published model, the stoichiometry was constrained to a single site, so the ligand preferred the site in between the two adjacent pockets. The key residues that interact with BH3I-1 within 5
  are highlighted in orange. In the current model, two BH3I-1 molecules bind adjacent to each other with distinctive affinities. Site A and B are circled and highlighted in yellow and red color, respectively.
Similar articles
-
Using chemical shift perturbation to characterise ligand binding.Prog Nucl Magn Reson Spectrosc. 2013 Aug;73:1-16. doi: 10.1016/j.pnmrs.2013.02.001. Epub 2013 Mar 21. Prog Nucl Magn Reson Spectrosc. 2013. PMID: 23962882 Review.
-
Chelerythrine and sanguinarine dock at distinct sites on BclXL that are not the classic BH3 binding cleft.J Mol Biol. 2006 Dec 1;364(3):536-49. doi: 10.1016/j.jmb.2006.09.023. Epub 2006 Sep 14. J Mol Biol. 2006. PMID: 17011577
-
Accuracy and precision of protein-ligand interaction kinetics determined from chemical shift titrations.J Biomol NMR. 2012 Dec;54(4):355-76. doi: 10.1007/s10858-012-9678-6. Epub 2012 Oct 21. J Biomol NMR. 2012. PMID: 23086713
-
The Sign of Nuclear Magnetic Resonance Chemical Shift Difference as a Determinant of the Origin of Binding Selectivity: Elucidation of the Position Dependence of Phosphorylation in Ligands Binding to Scribble PDZ1.Biochemistry. 2018 Jan 9;57(1):66-71. doi: 10.1021/acs.biochem.7b00965. Epub 2017 Nov 27. Biochemistry. 2018. PMID: 29144123
-
Quantitative analysis of protein-ligand interactions by NMR.Prog Nucl Magn Reson Spectrosc. 2016 Aug;96:47-57. doi: 10.1016/j.pnmrs.2016.02.002. Epub 2016 Mar 3. Prog Nucl Magn Reson Spectrosc. 2016. PMID: 27573180 Review.
Cited by
-
Combining automated peak tracking in SAR by NMR with structure-based backbone assignment from 15N-NOESY.BMC Bioinformatics. 2012 Mar 21;13 Suppl 3(Suppl 3):S4. doi: 10.1186/1471-2105-13-S3-S4. BMC Bioinformatics. 2012. PMID: 22536902 Free PMC article.
-
Structure of trans-resveratrol in complex with the cardiac regulatory protein troponin C.Biochemistry. 2011 Mar 1;50(8):1309-20. doi: 10.1021/bi101985j. Epub 2011 Jan 27. Biochemistry. 2011. PMID: 21226534 Free PMC article.
-
Simple high-resolution NMR spectroscopy as a tool in molecular biology.FEBS J. 2019 Jun;286(11):2035-2042. doi: 10.1111/febs.14771. Epub 2019 Feb 14. FEBS J. 2019. PMID: 30706658 Free PMC article.
-
NMR Studies of the Interactions between Sialyllactoses and the Polysialytransferase Domain for Polysialylation Inhibition.Curr Issues Mol Biol. 2024 Jun 7;46(6):5682-5700. doi: 10.3390/cimb46060340. Curr Issues Mol Biol. 2024. PMID: 38921011 Free PMC article.
-
Isothermal titration calorimetry and surface plasmon resonance analysis using the dynamic approach.Biochem Biophys Rep. 2019 Dec 17;21:100712. doi: 10.1016/j.bbrep.2019.100712. eCollection 2020 Mar. Biochem Biophys Rep. 2019. PMID: 31890903 Free PMC article.
References
-
- Van Dongen M, Weigelt J, Uppenberg J, Schultz J, Wikstrom M. Structure-based screening and design in drug discovery. Drug Discov Today. 2002;7:471–478. - PubMed
-
- Carlomagno T. Ligand-target interactions: what can we learn from NMR? Annu Rev Biophys Biomol Struct. 2005;34:245–266. - PubMed
-
- Takeuchi K, Wagner G. NMR studies of protein interactions. Curr Opin Struct Biol. 2006;16:109–117. - PubMed
-
- Roberts G. Applications of NMR in drug discovery. Drug Discov Today. 2000;5:230–240. - PubMed
-
- Bain AD. Chemical exchange in NMR. Prog Nucl Magn Reson Spectrosc. 2003;43:63–103.
Publication types
MeSH terms
Substances
LinkOut - more resources
Full Text Sources
