

Conformational dynamics and ligand binding in the multi-domain protein PDC109
- PMID: 20174627
- PMCID: PMC2823774
- DOI: 10.1371/journal.pone.0009180
Conformational dynamics and ligand binding in the multi-domain protein PDC109
Abstract
PDC109 is a modular multi-domain protein with two fibronectin type II (Fn2) repeats joined by a linker. It plays a major role in bull sperm binding to the oviductal epithelium through its interactions with phosphorylcholines (PhCs), a head group of sperm cell membrane lipids. The crystal structure of the PDC109-PhC complex shows that each PhC binds to the corresponding Fn2 domain, while the two domains are on the same face of the protein. Long timescale explicit solvent molecular dynamics (MD) simulations of PDC109, in the presence and absence of PhC, suggest that PhC binding strongly correlates with the relative orientation of choline-phospholipid binding sites of the two Fn2 domains; unless the two domains tightly bind PhCs, they tend to change their relative orientation by deforming the flexible linker. The effective PDC109-PhC association constant of 28 M(-1), estimated from their potential of mean force is consistent with the experimental result. Principal component analysis of the long timescale MD simulations was compared to the significantly less expensive normal mode analysis of minimized structures. The comparison indicates that difference between relative domain motions of PDC109 with bound and unbound PhC is captured by the first principal component in the principal component analysis as well as the three lowest normal modes in the normal mode analysis. The present study illustrates the use of detailed MD simulations to clarify the energetics of specific ligand-domain interactions revealed by a static crystallographic model, as well as their influence on relative domain motions in a multi-domain protein.
Conflict of interest statement
Figures
 1,
1,  1, and
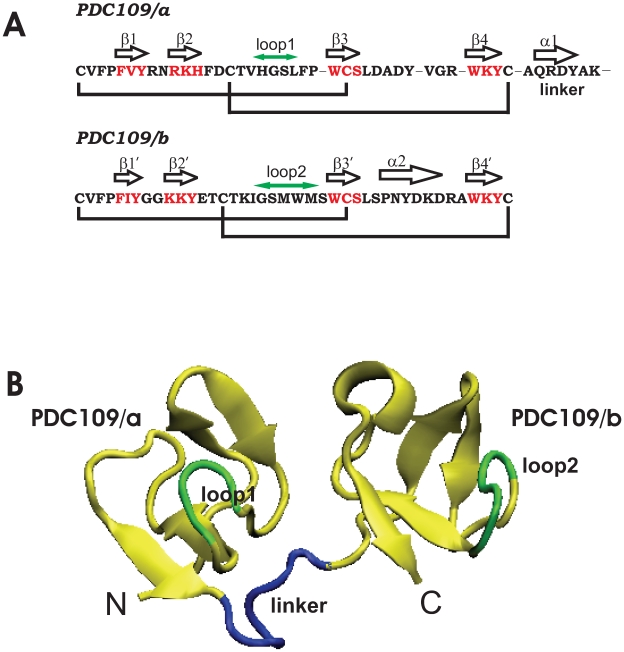
  2 for PDC109/a, linker, and PDC109/b, respectively. Loop 1 (H41-L44) between
  2 and
2 and  3 strands in PDC109/a and loop 2 (G87-M91) between the
  2
2 and
and  3
3 strands in PDC109/b are denoted by green arrows .
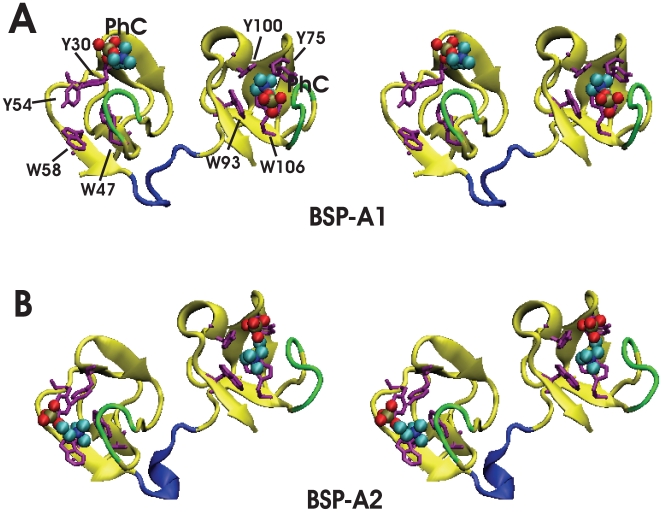
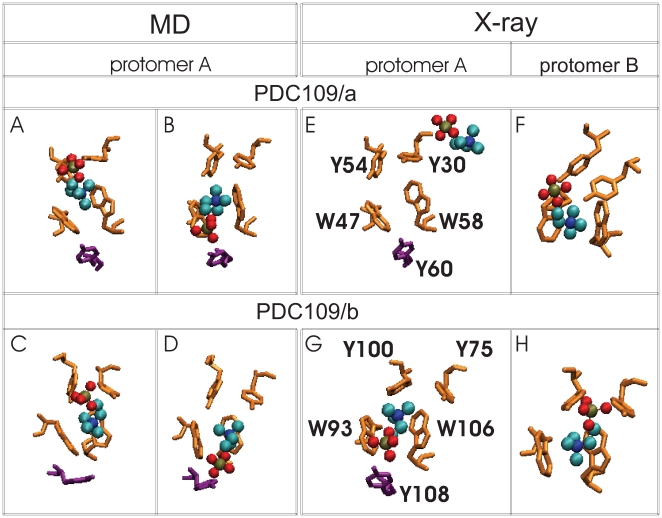
 D) are compared with corresponding binding site conformations from the crystallographic protomers A and B (E
 H). Snapshots showing PhC phosphate moiety interactions with specific protein side-chains are arranged as follows: (A) Y30 and Y54 at 60 ns, (B) Y60 at 100 ns, (C) Y75 and Y100 at 150 ns, and (D) Y108 at 175 ns. Binding site residues Y30, Y54, W47, W58 (from PDC109/a), and Y75, Y100, W93, W106 (from PDC109/b) are shown in orange, residues Y60 and Y108 (from PDC109/b) are shown in purple, while bound PhC molecules are shown as charge-colored spheres. Residue labels are indicated in the crystal structure panels E and G.
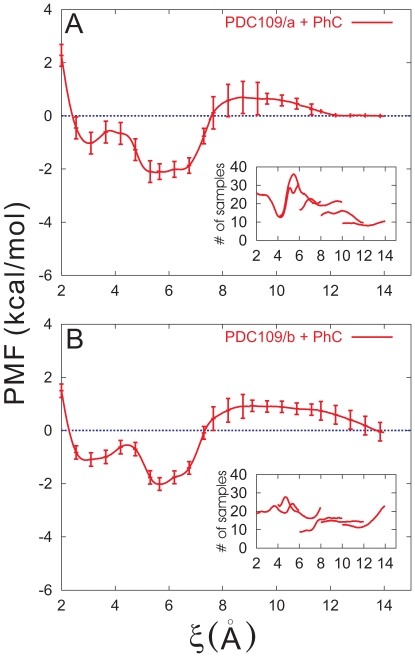
 ).
).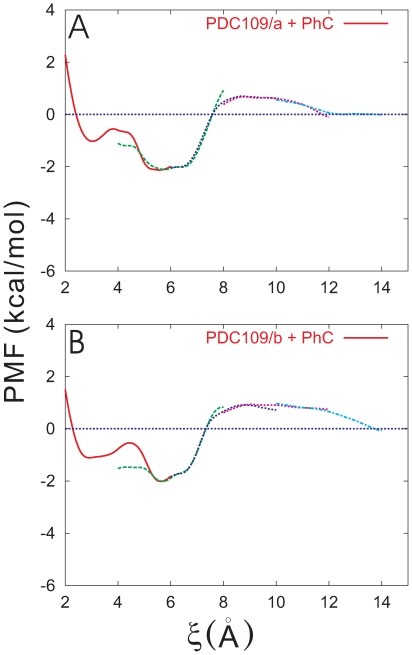
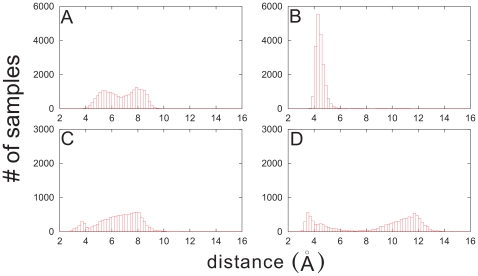
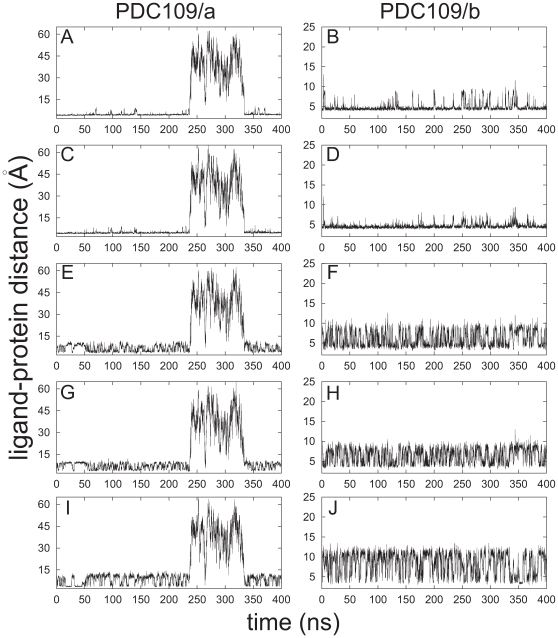
 3.5 Å) (A) and second (5.2 Å
 6.0 Å) (B) minima were calculated from the trajectory saved from the PMF calculation in the window 2.0 Å
 6.0 Å. The corresponding results for the separation between Y60 of PDC109/a and PhC phosphate group are shown in (C) and (D).
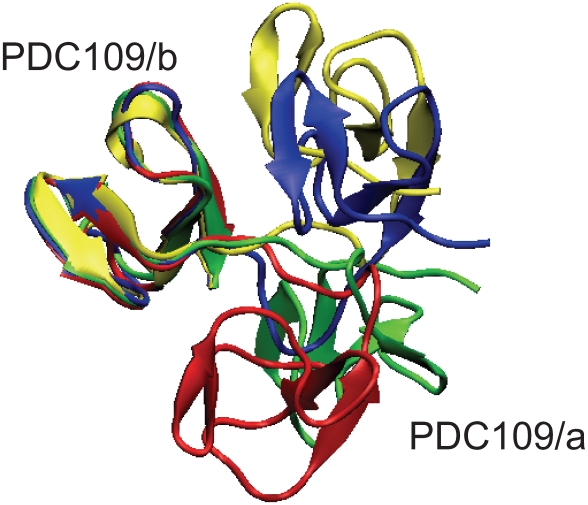
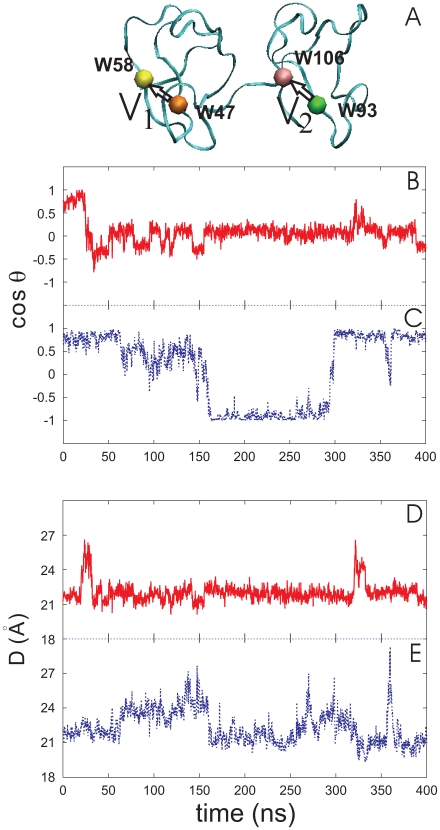
 is the angle between two vectors, V
 and V
and V
 in (A) , defined as displacements of C
 atom between W47 and W58 of PDC109/a and between W93 and W106 of PDC109/b, respectively. Fluctuations of
  are shown for ligand-free PDC109 in red (B) and for PDC109 complexed with PhC in blue (C). Fluctuations of center-to-center distance
  between two domains of PDC109 are in red (D) and of PhC-bound PDC109 are in blue (E).
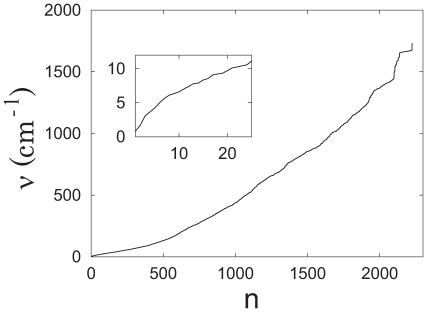
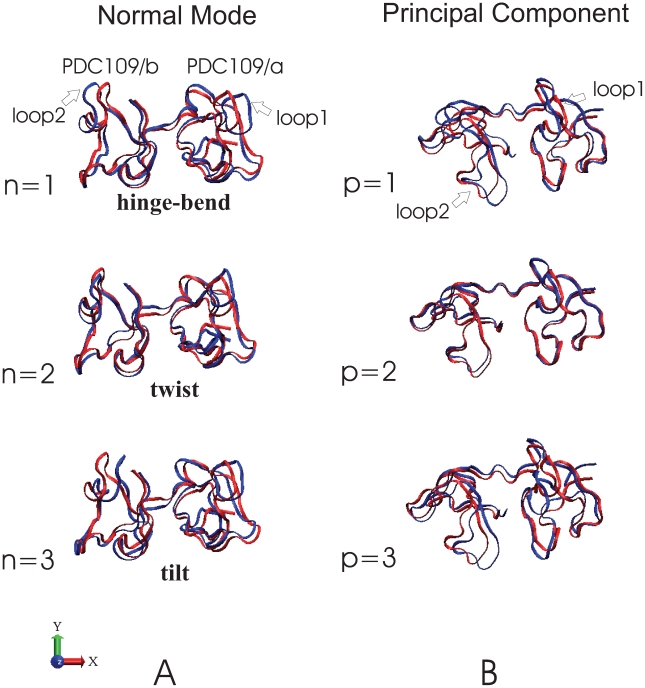
 (blue) with the normalized eigenvector vibrational amplitudes scaled by a factor of 200. The normal mode index
  corresponds to specific vibrational frequencies as follows:
  = 1 (hinge-bend),
  0.80 cm
 ;
;  = 2 (twist),
  1.72 cm
 ;
;  = 3 (tilt),
  3.08 cm
 . Overlapping ribbon conformations for the three largest amplitude principal components (p = 1, 2, 3) are shown with the reference structure (red) as displacements scaled by a factor of 200 standard deviations along each principal component (blue) .
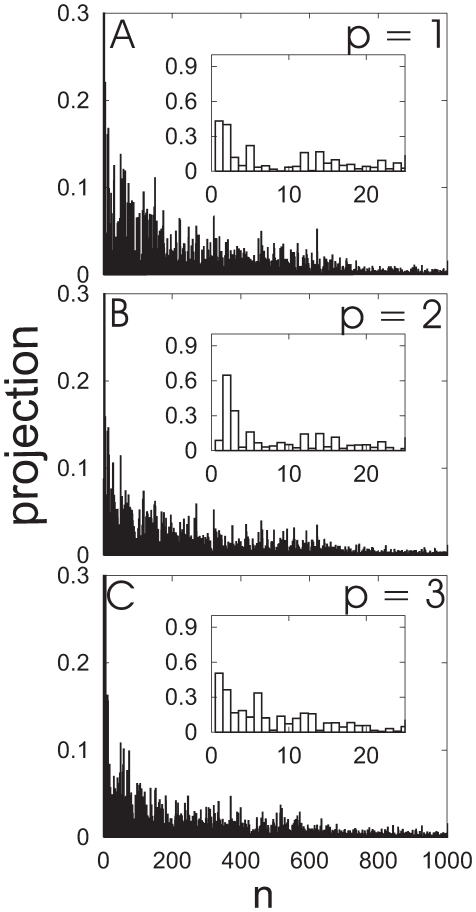
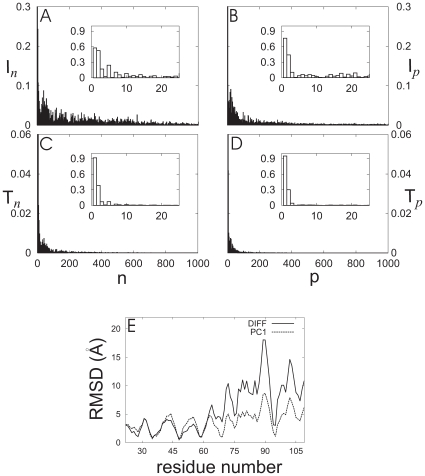
 ) and thermal involvement coefficients (
 ) in the space spanned by normal modes
  are displayed in (A) and (B), respectively. The corresponding decompositions into the principal components are shown in (C) and (D). Insets show a magnified view for low mode frequencies. (E) Residue-wise comparison of amplitudes of PC1 eigenvectors at 0
 and 180
 (PC1, dashed line) and conformational difference (DIFF, solid line) between ligand-free and PhC-bound PDC109. At each residue, backbone atom coordinates were averaged out and the normalized difference between opposite components was scaled by a factor of 2.36 to obtain a best-fit conformational difference.
Similar articles
-
Sperm coating mechanism from the 1.8 A crystal structure of PDC-109-phosphorylcholine complex.Structure. 2002 Apr;10(4):505-14. doi: 10.1016/s0969-2126(02)00751-7. Structure. 2002. PMID: 11937055
-
Fibronectin type II-module proteins in the bovine genital tract and their putative role in cell volume control during sperm maturation.Reprod Fertil Dev. 2009;21(3):479-88. doi: 10.1071/rd08209. Reprod Fertil Dev. 2009. PMID: 19261225
-
Bovine seminal plasma proteins and their relatives: A new expanding superfamily in mammals.Gene. 2006 Jun 21;375:63-74. doi: 10.1016/j.gene.2006.02.025. Epub 2006 Mar 14. Gene. 2006. PMID: 16678981
-
Evolution and function of mammalian binder of sperm proteins.Cell Tissue Res. 2016 Jan;363(1):105-127. doi: 10.1007/s00441-015-2289-2. Epub 2015 Sep 19. Cell Tissue Res. 2016. PMID: 26386584 Review.
-
Bovine seminal PDC-109 protein: an overview of biochemical and functional properties.Anim Reprod Sci. 2013 Apr;138(1-2):1-13. doi: 10.1016/j.anireprosci.2013.02.008. Epub 2013 Feb 22. Anim Reprod Sci. 2013. PMID: 23489472 Review.
Cited by
-
Structure-Based Virtual Screening to Identify Novel Potential Compound as an Alternative to Remdesivir to Overcome the RdRp Protein Mutations in SARS-CoV-2.Front Mol Biosci. 2021 Apr 9;8:645216. doi: 10.3389/fmolb.2021.645216. eCollection 2021. Front Mol Biosci. 2021. PMID: 33898520 Free PMC article.
-
Relative Movements of Domains in Large Molecules of the Immune System.J Immunol Res. 2015;2015:210675. doi: 10.1155/2015/210675. Epub 2015 Dec 21. J Immunol Res. 2015. PMID: 26798660 Free PMC article.
-
Structural and Dynamic Characterizations Highlight the Deleterious Role of SULT1A1 R213H Polymorphism in Substrate Binding.Int J Mol Sci. 2019 Dec 11;20(24):6256. doi: 10.3390/ijms20246256. Int J Mol Sci. 2019. PMID: 31835852 Free PMC article.
-
JED: a Java Essential Dynamics Program for comparative analysis of protein trajectories.BMC Bioinformatics. 2017 May 25;18(1):271. doi: 10.1186/s12859-017-1676-y. BMC Bioinformatics. 2017. PMID: 28545397 Free PMC article.
-
A Systematic Analysis of the Structures of Heterologously Expressed Proteins and Those from Their Native Hosts in the RCSB PDB Archive.PLoS One. 2016 Aug 12;11(8):e0161254. doi: 10.1371/journal.pone.0161254. eCollection 2016. PLoS One. 2016. PMID: 27517583 Free PMC article.
References
-
- Llinás M. The Conformational State of Iron Proteins. Struct Bonding. 1973;17:135–220.
-
- Vogel C, Bashton M, Kerrison ND, Chothia C, Teichmann SA. Structure, function and evolution of multidomain proteins. Curr Opin in Struc Biol. 2004;14:208–216. - PubMed
-
- Douglas JT, von Haller PD, Gehrmann M, Llinás M, Schaller J. The Two-Domain NK1 Fragment of Plasminogen: Folding, Ligand Binding, and Thermal Stability Profile. Biochemistry. 2002;41:3302–3310. - PubMed
-
- Braun T, Ghatkesar MK, Backmann N, Grange W, Boulanger P, et al. Quantitative time-resolved measurement of membrane protein-ligand interactions using microcantilever array sensors. Nature nanotechnology. 2008;4:179–185. - PubMed
Publication types
MeSH terms
Substances
Grants and funding
LinkOut - more resources
Full Text Sources
