

Intra-cluster percolation of calcium signals
- PMID: 20174630
- PMCID: PMC2823777
- DOI: 10.1371/journal.pone.0008997
Intra-cluster percolation of calcium signals
Abstract
Calcium signals are involved in a large variety of physiological processes. Their versatility relies on the diversity of spatiotemporal behaviors that the calcium concentration can display. Calcium entry through inositol 1,4,5-trisphosphate (IP3) receptors (IP3R's) is a key component that participates in both local signals such as "puffs" and in global waves. IP3R's areusually organized in clusters on the membrane of the endoplasmic reticulum and their spatial distribution has important effects on the resulting signal. Recent high resolution observations of Ca2+ puffs offer a window to study intra-cluster organization. The experiments give the distribution of the number of IP3R's that open during each puff without much processing. Here we present a simple model with which we interpret the experimental distribution in terms of two stochastic processes: IP3 binding and unbinding and Ca2+-mediated inter-channel coupling. Depending on the parameters of the system, the distribution may be dominated by one or the other process. The transition between both extreme case sis similar to a percolation process. We show how, from an analysis of the experimental distribution, information can be obtained on the relative weight of the two processes. The largest distance over which Ca2+-mediated coupling acts and the density of IP3-bound IP3R's of the cluster can also be estimated. The approach allows us to infer properties of the interactions among the channels of the cluster from statistical information on their emergent collective behavior.
Conflict of interest statement
Figures
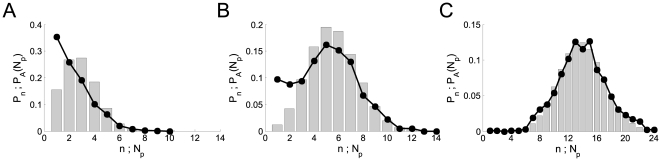
 , obtained with our model for
  ,
,  ,
,  and three values of
  :
:  (A),
(A),  (B) and
  (C). Histograms (in grey): corresponding distributions
of available channels,
(C). Histograms (in grey): corresponding distributions
of available channels,  for the same parameter values. All distributions were
computed from 1000 realizations for each set of parameters.
for the same parameter values. All distributions were
computed from 1000 realizations for each set of parameters.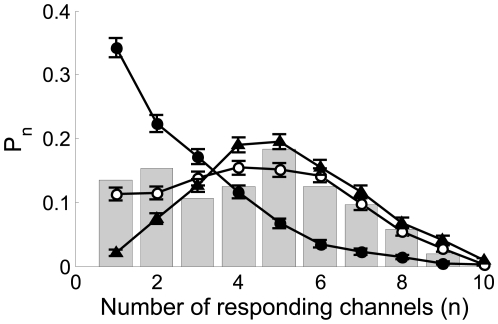
 , of having a puff with
  open channels obtained with our model for
  ,
,  ,
,  and
and  (solid circles),
  (open circles) and
  (triangles). Each curve corresponds to 500
realizations of the model. We observe a transition from a Ca
(triangles). Each curve corresponds to 500
realizations of the model. We observe a transition from a Ca -dominated to a IP
 -binding dominated stochasticity distribution as
  increases. Superimposed with bars: experimental data
taken from Fig. 4D
of .
increases. Superimposed with bars: experimental data
taken from Fig. 4D
of .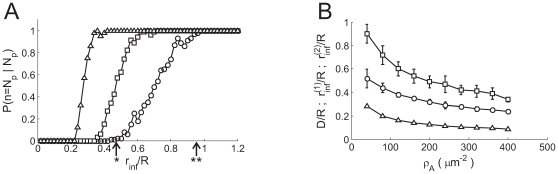
 R's become open,
  , as a function of the dimensionless radius of
influence,
, as a function of the dimensionless radius of
influence,  , for
, for  (circles),
  (squares) and
  (triangles). B:
  (circles),
  (squares) and
  (triangles) as functions of
  . The values of
  and
and  for the case with
  are indicated in A with one and two asterisks,
respectively.
are indicated in A with one and two asterisks,
respectively.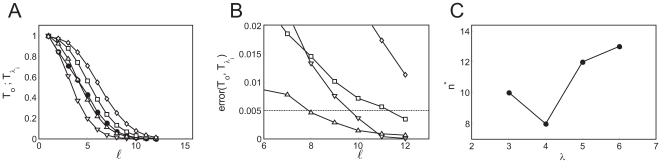
 for data obtained with our model using
  ,
,  ,
,  and
and  (solid circles). Complementary cumulative Poisson
distributions,
(solid circles). Complementary cumulative Poisson
distributions,  , for
, for  (inverted triangles),
  (triangles),
  (squares),
  (rhombes). B: Error of approximating
  by the various
  for
for  (see text for definition) as a function of
  . Symbols are the same as in A. From this figure we
choose
. Symbols are the same as in A. From this figure we
choose  as the one that provides the best fit to the tail of
  . The error in the
  case is larger than 0.02 in most cases and falls
outside the region displayed in the figure. C:
case is larger than 0.02 in most cases and falls
outside the region displayed in the figure. C:  for the four values of
  that we tested. We see that
  .
.Similar articles
-
Modeling the impact of store-operated Ca2+ entry on intracellular Ca2+ oscillations.Math Biosci. 2006 Dec;204(2):232-49. doi: 10.1016/j.mbs.2006.03.001. Epub 2006 Apr 19. Math Biosci. 2006. PMID: 16620876
-
A kinetic model of single and clustered IP3 receptors in the absence of Ca2+ feedback.Biophys J. 2007 Aug 15;93(4):1151-62. doi: 10.1529/biophysj.107.108795. Epub 2007 May 25. Biophys J. 2007. PMID: 17526578 Free PMC article.
-
Factors determining the recruitment of inositol trisphosphate receptor channels during calcium puffs.Biophys J. 2013 Dec 3;105(11):2474-84. doi: 10.1016/j.bpj.2013.10.028. Biophys J. 2013. PMID: 24314078 Free PMC article.
-
Spatial-temporal patterning of Ca2+ signals by the subcellular distribution of IP3 and IP3 receptors.Semin Cell Dev Biol. 2019 Oct;94:3-10. doi: 10.1016/j.semcdb.2019.01.012. Epub 2019 Feb 2. Semin Cell Dev Biol. 2019. PMID: 30703557 Free PMC article. Review.
-
Mitochondrial calcium signaling driven by the IP3 receptor.J Bioenerg Biomembr. 2000 Feb;32(1):15-25. doi: 10.1023/a:1005504210587. J Bioenerg Biomembr. 2000. PMID: 11768758 Review.
Cited by
-
Fluorescence fluctuations and equivalence classes of Ca²⁺ imaging experiments.PLoS One. 2014 Apr 28;9(4):e95860. doi: 10.1371/journal.pone.0095860. eCollection 2014. PLoS One. 2014. PMID: 24776736 Free PMC article.
-
Intracellular calcium signals display an avalanche-like behavior over multiple lengthscales.Front Physiol. 2012 Sep 3;3:350. doi: 10.3389/fphys.2012.00350. eCollection 2012. Front Physiol. 2012. PMID: 22969730 Free PMC article.
-
Modeling somatic computation with non-neural bioelectric networks.Sci Rep. 2019 Dec 9;9(1):18612. doi: 10.1038/s41598-019-54859-8. Sci Rep. 2019. PMID: 31819119 Free PMC article.
-
Abortive and propagating intracellular calcium waves: analysis from a hybrid model.PLoS One. 2015 Jan 20;10(1):e0115187. doi: 10.1371/journal.pone.0115187. eCollection 2015. PLoS One. 2015. PMID: 25602295 Free PMC article.
-
Multi-scale data-driven modeling and observation of calcium puffs.Cell Calcium. 2012 Aug;52(2):152-60. doi: 10.1016/j.ceca.2012.04.018. Epub 2012 Jun 6. Cell Calcium. 2012. PMID: 22682010 Free PMC article.
References
Publication types
MeSH terms
Substances
LinkOut - more resources
Full Text Sources
Other Literature Sources
Miscellaneous
