

A global analysis of the effectiveness of marine protected areas in preventing coral loss
- PMID: 20174644
- PMCID: PMC2822846
- DOI: 10.1371/journal.pone.0009278
A global analysis of the effectiveness of marine protected areas in preventing coral loss
Abstract
Background: A variety of human activities have led to the recent global decline of reef-building corals. The ecological, social, and economic value of coral reefs has made them an international conservation priority. The success of Marine Protected Areas (MPAs) in restoring fish populations has led to optimism that they could also benefit corals by indirectly reducing threats like overfishing, which cause coral degradation and mortality. However, the general efficacy of MPAs in increasing coral reef resilience has never been tested.
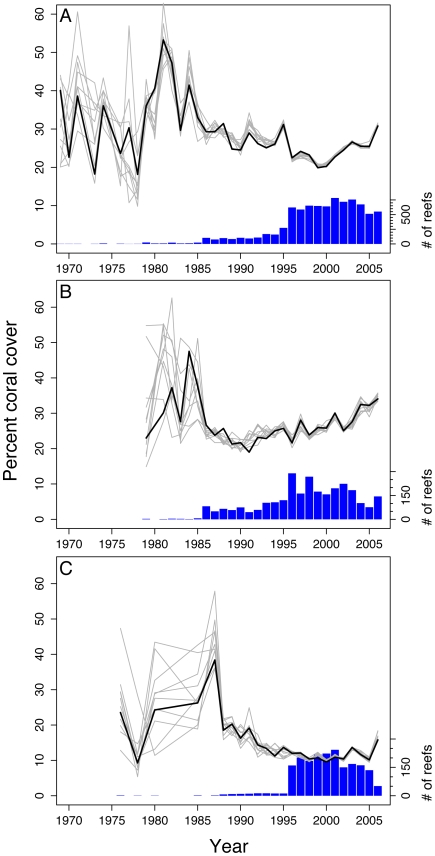
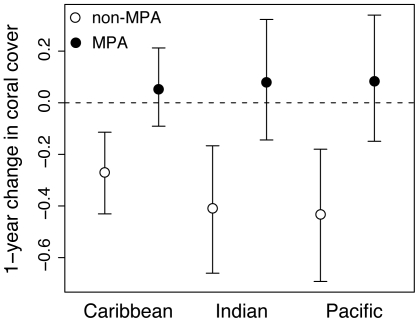
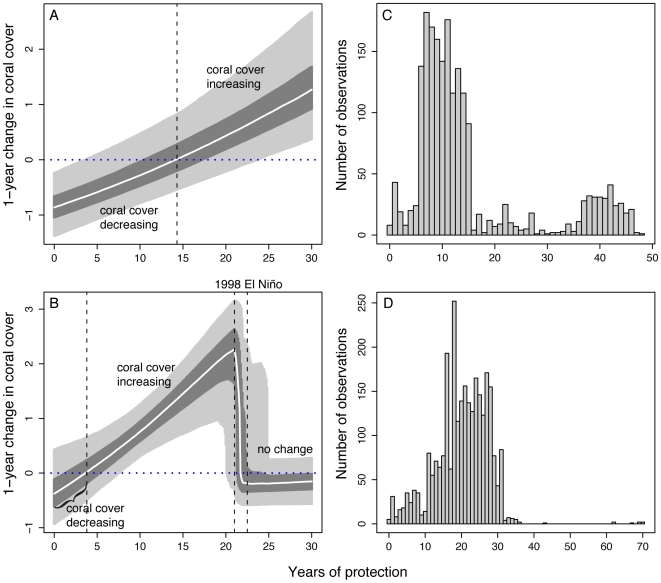
Methodology/principal findings: We compiled a global database of 8534 live coral cover surveys from 1969-2006 to compare annual changes in coral cover inside 310 MPAs to unprotected areas. We found that on average, coral cover within MPAs remained constant, while coral cover on unprotected reefs declined. Although the short-term differences between unprotected and protected reefs are modest, they could be significant over the long-term if the effects are temporally consistent. Our results also suggest that older MPAs were generally more effective in preventing coral loss. Initially, coral cover continued to decrease after MPA establishment. Several years later, however, rates of coral cover decline slowed and then stabilized so that further losses stopped.
Conclusions/significance: These findings suggest that MPAs can be a useful tool not only for fisheries management, but also for maintaining coral cover. Furthermore, the benefits of MPAs appear to increase with the number of years since MPA establishment. Given the time needed to maximize MPA benefits, there should be increased emphasis on implementing new MPAs and strengthening the enforcement of existing MPAs.
Conflict of interest statement
Figures

References
-
- Sebens KP. Biodiversity of coral-reefs - what are we losing and why. American Zoologist. 1994;34:115–133.
-
- Hughes TP, Baird AH, Bellwood DR, Card M, Connolly SR, et al. Climate change, human impacts, and the resilience of coral reefs. Science. 2003;301:929–933. - PubMed
-
- Bellwood DR, Hughes TP, Folke C, Nystrom M. Confronting the coral reef crisis. Nature. 2004;429:827–833. - PubMed
-
- Halpern BS. The impact of marine reserves: do reserves work and does reserve size matter? Ecological Applications. 2003;13:S117–S137.
-
- Mumby PJ, Dahlgren CP, Harborne AR, Kappel CV, Micheli F, et al. Fishing, trophic cascades, and the process of grazing on coral reefs. Science. 2006;311:98–101. - PubMed
Publication types
MeSH terms
LinkOut - more resources
Full Text Sources
