

Ferritin as a reporter gene for MRI: chronic liver over expression of H-ferritin during dietary iron supplementation and aging
- PMID: 20175142
- PMCID: PMC3558734
- DOI: 10.1002/nbm.1491
Ferritin as a reporter gene for MRI: chronic liver over expression of H-ferritin during dietary iron supplementation and aging
Abstract
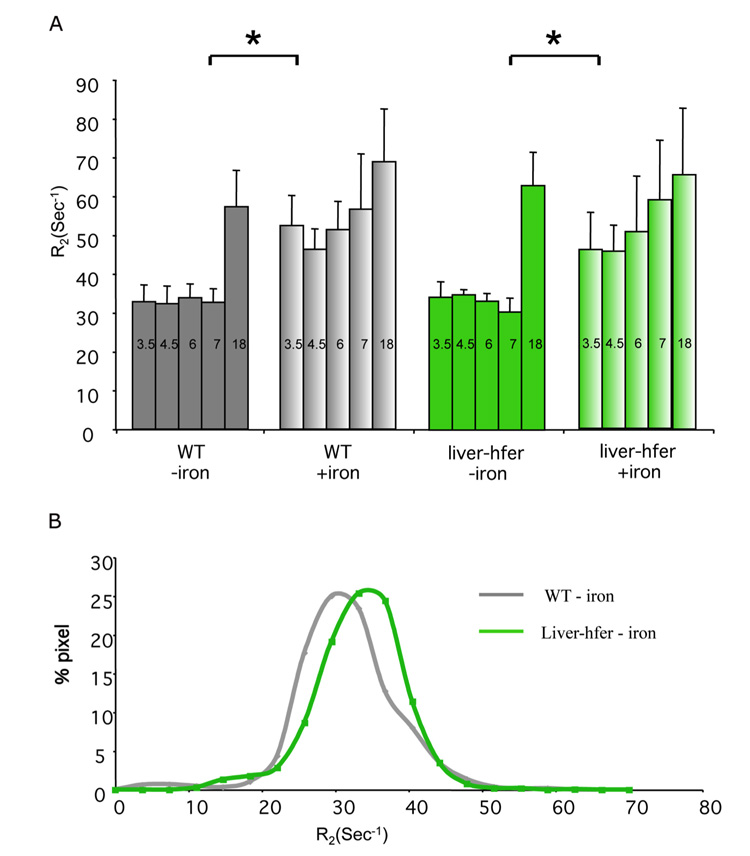
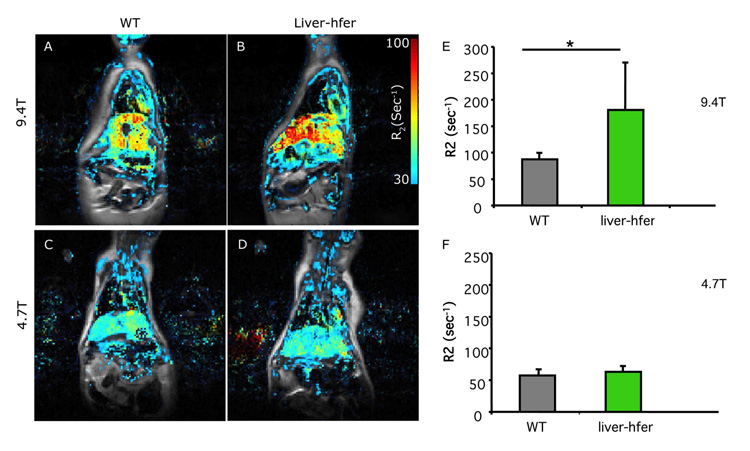
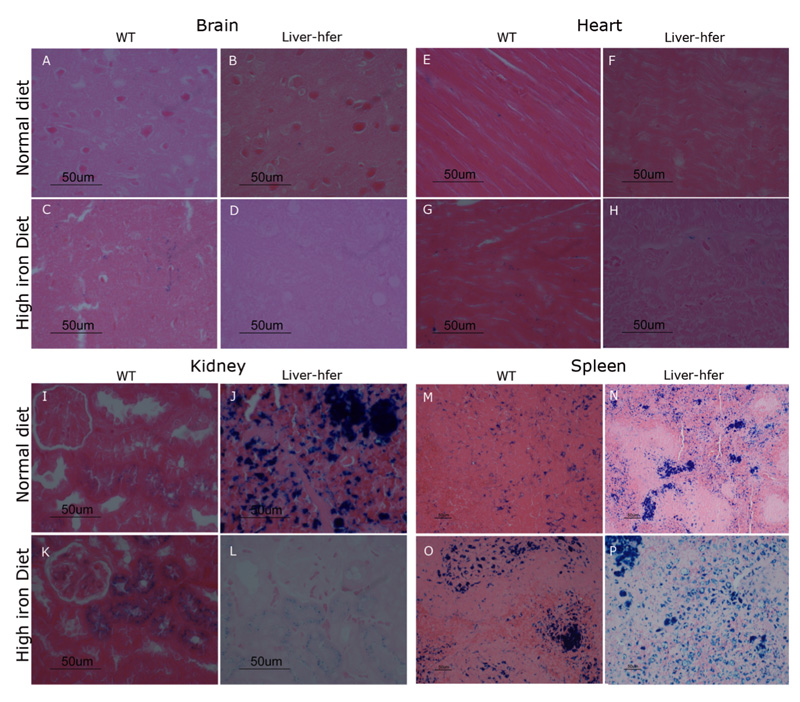
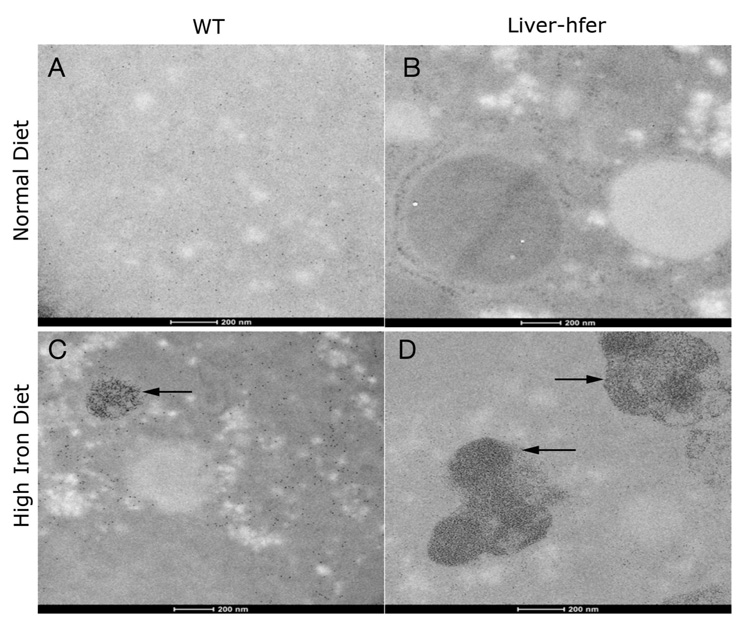
The iron storage protein, ferritin, provides an important endogenous MRI contrast that can be used to determine the level of tissue iron. In recent years the impact of modulating ferritin expression on MRI contrast and relaxation rates was evaluated by several groups, using genetically modified cells, viral gene transfer and transgenic animals. This paper reports the follow-up of transgenic mice that chronically over-expressed the heavy chain of ferritin (h-ferritin) in liver hepatocytes (liver-hfer mice) over a period of 2 years, with the aim of investigating the long-term effects of elevated level of h-ferritin on MR signal and on the well-being of the mice. Analysis revealed that aging liver-hfer mice, exposed to chronic elevated expression of h-ferritin, have increased R(2) values compared to WT. As expected for ferritin, R(2) difference was strongly enhanced at high magnetic field. Histological analysis of these mice did not reveal liver changes with prolonged over expression of ferritin, and no differences could be detected in other organs. Furthermore, dietary iron supplementation significantly affected MRI contrast, without affecting animal wellbeing, for both wildtype and ferritin over expressing transgenic mice. These results suggest the safety of ferritin over-expression, and support the use of h-ferritin as a reporter gene for MRI.
Figures


Similar articles
-
MR molecular imaging of tumours using ferritin heavy chain reporter gene expression mediated by the hTERT promoter.Eur Radiol. 2016 Nov;26(11):4089-4097. doi: 10.1007/s00330-016-4259-9. Epub 2016 Mar 9. Eur Radiol. 2016. PMID: 26960542 Free PMC article.
-
Overexpression of the MRI Reporter Genes Ferritin and Transferrin Receptor Affect Iron Homeostasis and Produce Limited Contrast in Mesenchymal Stem Cells.Int J Mol Sci. 2015 Jul 8;16(7):15481-96. doi: 10.3390/ijms160715481. Int J Mol Sci. 2015. PMID: 26184159 Free PMC article.
-
MRI detection of transcriptional regulation of gene expression in transgenic mice.Nat Med. 2007 Apr;13(4):498-503. doi: 10.1038/nm1497. Epub 2007 Mar 11. Nat Med. 2007. PMID: 17351627
-
Bimodal lentiviral vector encoding myc-tagged human ferritin heavy chain and green fluorescent protein (GFP).2011 Feb 2 [updated 2011 Mar 9]. In: Molecular Imaging and Contrast Agent Database (MICAD) [Internet]. Bethesda (MD): National Center for Biotechnology Information (US); 2004–2013. 2011 Feb 2 [updated 2011 Mar 9]. In: Molecular Imaging and Contrast Agent Database (MICAD) [Internet]. Bethesda (MD): National Center for Biotechnology Information (US); 2004–2013. PMID: 21413198 Free Books & Documents. Review.
-
Nature of storage iron turnover.Nagoya J Med Sci. 2024 Aug;86(3):361-369. doi: 10.18999/nagjms.86.3.361. Nagoya J Med Sci. 2024. PMID: 39355366 Free PMC article. Review.
Cited by
-
Protein and peptide engineering for chemical exchange saturation transfer imaging in the age of synthetic biology.NMR Biomed. 2023 Jun;36(6):e4712. doi: 10.1002/nbm.4712. Epub 2022 Feb 27. NMR Biomed. 2023. PMID: 35150021 Free PMC article. Review.
-
The Continuing Evolution of Molecular Functional Imaging in Clinical Oncology: The Road to Precision Medicine and Radiogenomics (Part II).Mol Diagn Ther. 2019 Feb;23(1):27-51. doi: 10.1007/s40291-018-0367-3. Mol Diagn Ther. 2019. PMID: 30387041 Review.
-
Magnetic Resonance Imaging Tracking of Graft Survival in the Infarcted Heart: Iron Oxide Particles Versus Ferritin Overexpression Approach.J Cardiovasc Pharmacol Ther. 2014 Jul;19(4):358-367. doi: 10.1177/1074248414525999. Epub 2014 Mar 30. J Cardiovasc Pharmacol Ther. 2014. PMID: 24685664 Free PMC article.
-
Adenoviral vector mediated ferritin over-expression in mesenchymal stem cells detected by 7T MRI in vitro.PLoS One. 2017 Sep 25;12(9):e0185260. doi: 10.1371/journal.pone.0185260. eCollection 2017. PLoS One. 2017. PMID: 28945778 Free PMC article.
-
Quantification of MRI signal of transgenic grafts overexpressing ferritin in murine myocardial infarcts.NMR Biomed. 2012 Oct;25(10):1187-95. doi: 10.1002/nbm.2788. Epub 2012 Feb 24. NMR Biomed. 2012. PMID: 22362654 Free PMC article.
References
-
- Arredondo M, Nunez MT. Iron and copper metabolism. Mol Aspects Med. 2005;26(4-5):313–327. - PubMed
-
- Chiancone E, Ceci P, Ilari A, Ribacchi F, Stefanini S. Iron and proteins for iron storage and detoxification. Biometals. 2004;17(3):197–202. - PubMed
-
- Siah CW, Trinder D, Olynyk JK. Iron overload. Clin Chim Acta. 2005;358(1-2):24–36. - PubMed
-
- Gottesfeld Z, Neeman M. Ferritin effect on the transverse relaxation of water: NMR microscopy at 9.4 T. Magn Reson Med. 1996;35(4):514–520. - PubMed
-
- Vymazal J, Brooks RA, Bulte JW, Gordon D, Aisen P. Iron uptake by ferritin: NMR relaxometry studies at low iron loads. J Inorg Biochem. 1998;71(3-4):153–157. - PubMed
Publication types
MeSH terms
Substances
Grants and funding
LinkOut - more resources
Full Text Sources
Medical
Research Materials
